As far as the contiguous United States are concerned, the year 2015 was the 2nd warmest on record, second only to the year 2012. We have had 19 consecutive years of above average temperatures. 1996 marks the last time we had below average temperatures nationwide.
It was the warmest Autumn on record for the continental U.S. In addition, December was the warmest month on record
It was also the 3rd wettest year on record, with 1973 and 1983 wetter, they too strong El Nino years.
I am sure to dredge up more statistics when I can. Also, I plan to reveal the global climate situation in a future post.
MS
Tuesday, January 26, 2016
Monday, January 25, 2016
MikJournal Monday 01/25/16
Well, I had 7.5" snow last week at the house here in Valley Station. It looks a lot like it did back in March when I shoveled out my driveway in the front and back of the house.
I also tied my lowest temperature for the season at 9 degrees yesterday morning, thanks in part to the existing snowpack.
However, the snowpack is dwindling as sunshine has been eroding the stockpile. I started yesterday at about 4-5"; now, it's down to 2-3".
But, it was fun while it lasted. I took my little girl sled riding at a nearby Metro Parks approved location for such an event. The hills were steep and fast. Lots of broken plastic sleds were sprawled about the area. Of course, that was most likely the result of drop-offs when one would gather lots of speed down the hill and suddenly you were airborne for a moment before crashing back to the packed surface and continue downhill. Needless to say, our plastic sled performed much better than others' and remained in one piece.
I have read the reports of others in the region. Some of you have had between 1 and 2 feet of snow, mainly over the first part of the weekend. For snow lovers, it was a dream come true.
Then again, even the snow lovers had to contend with just trying to get out of the house as snow drifts no doubt piled against some of your front or back porches. Perhaps you were one of the unfortunate ones who were stranded along a stretch of I-75 Friday night for hours while snow pummeled your location. Or, enduring hours of having no power proved quite disheartening for some. Why, travel in general was pretty hard to do even if you could get out of the driveway to enjoy the sites of your winter wonderland.
We weren't the only ones who had the snow in the region. While the entire state of Kentucky had some measurable snow during the past week, the Midwest sector, which we are a part of, peaked at nearly 80% coverage on January 22.
In fact all of the NWS official locations that include Paducah, Bowling Green, Lexington, Louisville, and Jackson have above average snowfall now for this time of the year.
Surprisingly, many mountainous regions and favored locations along the Great Lakes have seen below average snowfall for the season.
But, Crater Lake National Park out in Oregon is above average. After a record-setting December, this month has been an above average one as well. They have now tipped the scales at over 300" since the season began.
On the other hand, Mount Washington NH, home of the world's worst weather, has had below average snowfall. As I write this, only 85.0" has accumulated so far this season. A normal snow season is about 281". Of course, we still have a ways to go as February and March are typically snowy as well. And April is somewhat productive too.
I will say this though about Mount Washington. On January 19, the daytime high was -9 and the low temperature was -22. Winds gusted to 127 mph at the top of the 6,280 ft summit. The average temperature being -15 and the average wind speed at 86 mph produced an average wind chill of -60! Can you say ouch??
Looking ahead, the weather will be turning warmer as the AO which has been trending toward neutral should become positive for a brief time. Recall that I mentioned something about a transition, going from a negative state to a positive one can have exciting consequences for fans of winter weather. Well, you just got your reward. Now, the January Thaw will commence for a time before the next change or transition takes place.
It has something to do with the Polar Vortex. Ah, the infamous Polar Vortex. I can see it now. Hollywood is probably already coming up with a script where a fat man in a red suit is storm chasing and comes upon an abominable snowman-looking tornado near his home at the North Pole, doing everything he can to rescue his family and workers before disaster strikes, since they have poor cell phone reception and no outdoor sirens to alert the public for life-threatening weather emergencies.
Anyway, it will be turning much colder as we get into the month of February. My February prediction comes out later this week.
MS
Saturday, January 23, 2016
After the Storm...01/22/16
Well, Kentucky's winter storm is still ongoing but winding down for many. Lots of double-digit snowfall amounts have been received, especially from central into eastern parts of the state.
Jackson KY surpasses the January 1996 snowstorm and eventual blizzard for 2-day snowfall record at 16.2". Remember, the January 1996 blizzard kept showing up in top analogs for this storm system. The awesome 1993 storm of March was the only other time period that outshone this current event. Records date back to 1981.
I have read amounts of 18-19". Wow! Some parts of far eastern Kentucky may still get additional accumulations adding to some who already have double-digit totals.
Bowling Green's 12.2" yesterday obviously set a daily record, but also goes into the record books as the 3rd snowiest day ever for any month and the snowiest January day on record. In addition, the monthly total of 14.8" now ranks as the 6th snowiest month of January.
A massive traffic snarl on I-75 stranded thousands for a time after a series of crashes led to both sides of the interstate to be closed.
Also, power outages became issues for some residents in Knox, Whitley, and Pulaski counties. Each of their electric cooperatives were working to restore power to these residents still as of early this morning.
MS
Thursday, January 21, 2016
NOWCAST II For Possibly Crippling Snow
Well, don't I sound like a doomsday prophet? I typically try and control my emotions when it comes to a significant weather happening. However, this storm looks to rank among the likes of last March here in Kentucky. In addition, it could potentially become a powerful blizzard, similar to the Blizzard of 1996 for the Eastern seaboard.
Shutdown snowfall looks to be a strong possibility for many along the East coast, and the potential for major power outages across parts of Virginia and the Carolinas from a serious ice storm.
This weather system is so formidable that for the first time I have seen, a live press conference was carried out on one of my local media outlets with representatives from the Public Works department for road crews, the NWS , and Jefferson County Public Schools convening to discuss the impending storm.
After 4:00a.m., I will be posting any significant changes to possible amounts from NWS and local media as well as my thoughts here below....
----------------------------
5:25am
Louisville forecast is now solidly 6-8" for most. Slightly lower in far north part of the county and perhaps 8+" out where I live in SW Jefferson
Snow reported near Sonora along I-65.
------------------
9:20am
Welcome to the MikJournal Doughnut Hole capital of Louisville. Finally, the radar surrendered a few flakes at 9:05.
--------------
9:25am
I did notice that NWS Louisville lowered Louisville's overall totals by about an inch...3-7"
I am still expecting at least 7" at my location in Valley Station.
---------------
9:50am
4" now reported in West Paducah, Madisonville, and Cadiz
4" also in Paint Lick and Campbellsville
4.5" near Bowling Green
----------------
11:30am
A lull in the activity here at the house...just measured 1.3". I was projecting 3" at the house by noon. With heavier snow still pretty far south of my area, I'll be a bit shy of the 7" total I was expecting at the house.
---------------
12:15pm
Some area snowfall reports as of noon
8" - Hobson (Taylor County)
7-8" - Bowling Green
6" - Liberty
6" - Berea
5" - Lancaster (Lincoln County)
---------------------
12:55pm
Closing in on 2" in Valley Station...on track for 5-6" here unless we get in on overachieving bands.
--------------------
1:05pm
Latest HRRR has Louisville in a 3-6" total
----------
2:10pm
Heavier bands increasing along Ohio River, beginning to show signs of a deformation...this could become our most productive accumulation over the next couple of hours. Could see 2 more inches at least.
-----------
2:15pm
Snowfall amount at my house stood at 2.0" but a deformation band of increasingly heavier amounts may end up doubling this total in the next few hours.
------------
2:30pm
Additional snow amounts for some of us to covet...
Lebanon...12"
Bonnieville...11"
Greensburg...9"
---------
7:10pm
Snow is winding down here at my house...yes, somewhat disappointing but I did record more snow this time than with system #1, which had 3.5"
My total so far and we probably won't get much more is....3.8"
----------------
9:10pm
Final update....
Power outages have become a problem for some residents due to the storm system
My total was 4.0"
MikJournal Call for Snowfall...System II
Here goes it....
Louisville....4-9"
Mount Washington....7-11"
Bardstown...6-12"
Lexington....5-10"
E'town...6-12"
Richmond...6-12"
Morehead...5-10"
London...8-16"
I will say that the highest amounts do face a certain amount of uncertainty, as sleet or rain may interfere with snow totals.
My confidence in the above forecast is medium, definitely not high. And I chose only a few locations because I already have a headache just from these locations above.
MS
System 2 to Make a Fool of Us Too
Well, I said that I would wait until this morning's run of the NAM before issuing my snowfall forecast. And I am, reluctantly.
I am trying to come up with a sensible forecast, but my typical confidence in the NAM does not meet criteria for disseminating amounts that I feel comfortable with.
Nevertheless, I will have amounts posted by noon today for central and east Kentucky.
Again, let me emphasize that this will not be an easy forecast, I don't care how confident even the professional Mets feel.
So many dynamics that hopefully, the short term models will make sense of it. Right now, central Kentucky appears to be the bullseye, but this will also be the area that a mix could alter totals significantly.
Check back after 12:00 today for my call for snowfall.
MS
Wednesday, January 20, 2016
The Blizzard of 1996...Could System #2 Become a Copycat?
In lieu of the impending winter storm coming up in less than 48 hours, I have noticed that the American models have now both highlighted the 'Blizzard of 1996' as their #2 analog. Some of the expectations are eerily similar to the event that occurred nearly 20 years ago.
Here's an excerpt from Central Kentucky in the National Climatic Data Center's Storm Data publication...with apologies on the alignment of the text below.
freezing rain initially fell in Bell and Harlan Counties, total amounts averaged between 6 and 14 inches.
And from Northern Kentucky....
Blizzard of '78.
Thanks again to the NCDC Storm Data Publication for the January 1996 report.
MS
Here's an excerpt from Central Kentucky in the National Climatic Data Center's Storm Data publication...with apologies on the alignment of the text below.
A major snow storm hit Kentucky on January 6-7, 1996. The snow began around noon est and effected all of the counties in the
Louisville CWA before it stopped Sunday afternoon. The heavy snow began around 1500 est on the 6th and ended around 6 am est
on the 7th. A strong double-barreled low pressure system moved from the Gulf states on the 6th to Georgia and then the South
Carolina coast by the afternoon of the 7th. The snow became light and moved East of the CWA by 0000 est on the 8th. Between 2
and 6 inches of snow fell across the CWA by 2030 est. Meade, Breckinridge, Larue, Bullitt and Hardin Counties all reported up to
6 inches across their respective counties, while Spencer County led the way with 7 inches of accumulation. By 0200 est, between 5
and 12 inch total accumulations were reported. Green and Laurel counties had 12 inches. By 0600 est on the 7th, totals were from
6 inches at several locations to 16 inches in Laurel County. Totals were from 7 to 12 inches across east central Kentucky to 7 to 16
inches across south central Kentucky to 6 to 12 inches across north central Kentucky. Little additional snow was reported after
0600 est. Laurel County still led the way with 16 inches in spots.
Also, from Eastern Kentucky....
A major winter storm brought heavy snow to all of southeast Kentucky. By noon EST on the 6th, 3 to 5 inches of snow had fallen
across the region. Heavier snow began around 1500 EST on the 6th, when 5 to 6 inches were on the ground. Amateur radio
operators reported 9 inches across much of southeast Kentucky at 2100 EST, and 10 to 11 inches by 2300 EST. By 1100 EST on
the 7th, 14 to 16 inch amounts were common, with 15 to 17 inches covering much of the area by 1300 EST. Total snowfall
reported at 1645 EST on the 7th averaged between 14 and 22 inches, with the heaviest amounts in Pike County. Where rain and
The Blizzard of '96 developed near the Gulf Coast and moved up the East Coast. This massive system brought the greatest
snowfall from one storm to Greater Cincinnati/Northern Kentucky airport, as well as the greatest 24 hour snowfall. Total snowfall
from this storm at the airport was 14.3 inches, while in a typical entire season this location normally receives only 23 inches of
snowfall. Many homes and business experienced partial or total roof collapses due to the weight of the snow. Road conditions
remained hazardous in some locations for many days. Many people believed that this was the worst winter storm since the
Blizzard of '78.
Thanks again to the NCDC Storm Data Publication for the January 1996 report.
MS
Tuesday, January 19, 2016
NOWCAST Part I of II
Let's see if System #1 is as spunky as advertised...or will the dreaded dry air eat away at this thing for many of us? Will sleet enter the picture down south, altering snow totals a bit? Stay tuned....
Updates start here....Probably after 4:00 a.m.
4:15am
Snow-covered roads on my way home from the Louisville Int'l airport. Average speed traditionally 35-65 mph, well, the drive averaged this time around 25-35 mph.
At my house in Valley Station, snow has accumulated 1.5".
Need to get caught up on amounts elsewhere....
-----------------------------------------------------
4:35am
Snow has begun falling in Bowling Green during the last hour or so.
Evansville IN has 3". Not too many storm reports coming in yet, but estimates of over 3" in western KY as of 3:00am est.
Not snowing in Lexington as of 4:00 am, but should be by now as I write this.
Check out the following page from the NWS Louisville....
http://www.weather.gov/lmk/dss
--------------------------------------------------------
4:50am
Winter Storm Watch now in effect for much of Louisville CWA for the Thursday night - Saturday system.
-----------------------------------------------
5:15am
Last measurement for now at my house...1.8" with light snow
I'm going to bed for a little bit....
-------------------------------------
8:15am
Last push of moderate to heavy snow for me...closing in on 3".
Bowling Green has been getting pummeled for parts of the last hour and a half...like to know how much they have seen....
9:15am
Still waiting for snow to stop, falling lightly now...my total stands at 3.3".
Reports from Bowling Green have not been as impressive as I thought I was going to hear, anywhere between 1 and 3" as snow looks to be tapering there.
Saw 3.3" out of Evansville IN but only 1.2" from west Paducah.
12:30pm
Final issuance for this Nowcast session.
No major accumulations I have seen so far. I'm sure some renegade amount will be posted by the end of the day. I received 3.5" at my house in Valley Station. I have read of numerous reports of 3-4" in Louisville. So, a little higher than my forecast of 2-3". Otherwise, my prediction for up to 5", which seemed conservative compared to other media outlets of up to 6", may have been too high. A lot of 4" amounts though.
MikJournal Call for Snowfall on Wednesday the 20th
Since there are two systems arriving this week, I have to separate them, you see.
First, our system #1 arrives overnight into the daylight hours on your Wednesday with snow the primary p-type.
It will encounter a formidable air mass, modifying the temperature and dewpoint of the atmosphere as it chugs along. How long that takes for snow to reach the ground will result in the difference between a decent accumulation and a significant accumulation.
The heaviest snow will fall nearest and just north of the low pressure track. Imagine in your mind the low traveling from northwest to southeast then curving east southeast then eastward.
Areas where the low makes that curve should experience the heaviest snowfall amounts. But again, system #1 will be battling a fiercely dry airmass, weakening somewhat as it runs into this stubborn wall. Any additional moisture gained from the Gulf will simply be offset somewhat by the modification process, and this will be evident for one who is farther north of the low.
Since this is a system of Pacific origin, a reinforcement of Arctic air will not happen after the system exits. Nevertheless, any snowpack will affect the air at and just above the surface and pave the way for our system #2.
Based on the NAM's 0z run last night and the 12z run this morning along with a fudge factor on my part, here are some select amounts for parts of western Kentucky to areas along and west of I-75 for the Wednesday system only....
Leitchfield....3-4"
Greenville.....3-5"
Princeton......3-5"
Bowling Green...2-4"
E'Town....2-4"
Louisville....2-3"
Carrollton...1-3"
Campbellsville...2-3"
Lexington.....1-2"
Frankfort....1-3"
MS
Monday, January 18, 2016
MikJournal Monday 01/18/16
Welcome to a busy week of weather. Time for everyone to be watching their local news outlets, blogs, social media, googling forecast models and hanging by every run of each of those models, and watching The Weather Channel...did I just say that? Well yes. Did you know they will actually carry out nearly continuous coverage of significant weather happenings just like the old days when their slogan used to be 'Weather You Can Always Turn To'?
Speaking of The Weather Channel, somehow I missed this one, but Kim Perez in 2009 gets a surprise when talking about the forecast "'Ring'ing in the New Year"...check out the video.
Ok, enough of that mushy stuff. Let's talk about winter.
Our first region-wide snow event is on track to give a decent snow accumulation for us by midweek. When I say decent, I mean at least 2.0", something that a cheap, kitchen floor broom would struggle with when sweeping snow off your porch or walkway.
Plus, the usual traffic headaches and the dilemma to shut down schools, and the conundrum for some, 'Should I go to work and risk my life when they don't pay me enough anyway?' mentality.
Yet, there is another weather system to follow the midweek one. Right now, it's a toss up. At some time, milder weather will be slowly infiltrating the region. How this second storm system will develop may depend to a large extent on how much snow is around from the previous one.
I am looking for a mixed bag of slop, the usual snow and sleet, with rain also, falling on ground that still has snow. More rain south, but perhaps mostly snow and sleet the farther north toward the Ohio River.
I'll be posting soon for my forecast based on the NAM at 24-36 hours out. Probably Tuesday morning after a consideration of all model runs leading up to and including the 12z run of the NAM. I will assign the typical 70-80% confidence of the model run and the typical 20-30% 'Does this make sense to me?' by making sure dry air will not eat away at our future accumulation, for example.
Looks like an active week. If you love snow, I hope you get it.
MS
Sunday, January 17, 2016
Louisville and Lexington Snow Numbers Over the Years
I collected 25 years of data for Louisville and Lexington relating to snow days and amounts. Some of the numbers are very revealing, some surprising. Here is a compilation of the data....
Lexington
This first segment is pretty fun. I look at how many days of measurable snow (>=0.1").
Averages (# of days):
November: 1
December: 3
January: 5
February: 4
March: 2
During the last 25 years, the most days of measurable snow occurred during 2013/2014. Remember, the beginning of snow season is July 1 and ends June 30 according to NWS records. The 2013/2014 total number of measurable snow days was 28. The 1995/96 number was 27 for a close second place.
The least amount of measurable snow days occurred during 1996/97 when only 5 days was recorded. The 2 days in January and 3 days in February was all she wrote for that time period.
The next segment focuses a little more on snow days when measurable snow exceeded at least 2.0".
Averages (# of days)
November: 0
December: 0
January: 1
February: 1
March: 0
Wow! The averages came way down once this criteria was entered. One thing to remember though is the numbers above have been rounded either up or down. In other words, this does not mean that Lexington did not have any measurable snow days in excess of 2" for the month of December over the last 25 years. Actually, they recorded a total of 8 days during those 25 years. For you math lovers out there, that equates to 0.32 days/year. We would have needed at least 0.50 to round up to the nearest whole number.
The period of 2010/11 tops the list at 6 days when measurable snow was at least 2.0".
There were 6 periods when at least 2.0" was not recorded for a single day. Here is a list of those periods.
1990/91
1991/92
1996/97
1998/99
1999/2000
2004/05
The last segment will only highlight the maximum number of significant snow days of at least 4.0".
During the last 25 years, only 2014/2015 had a total of 4 days when snowfall was at least 4.0". There were a couple of periods that came in second place with a total of 3.
Finally, here is my favorite overall segment...maximum total snowfall for any given period during the last 25 years. Here is the list for Lexington (a period covers July 1-June 30):
1) 2014/2015......40.0"
2) 1993/1994......31.7"
3) 1995/1996......31.4"
4) 2010/2011......27.8"
5) 2013/2014......27.1"
6) 2009/2010......23.7"
7) 1992/1993......23.3"
...and the minimum total snowfall for any given period during the last 25 years.
1) 1991/1992......3.2"
2) 1996/1997......4.0"
3) 1998/1999......4.1"
4) 1999/2000......5.2"
5) 1990/1991......5.8"
5) 2004/2005......5.8"
Did you know???
Lexington's 2014/15 period of 40.0" fell just short of the 42.1" set during the infamous 1977/78 period. Again, though, as I have emphasized, the snow season runs from July 1 and ends June 30. However, if you look at the calendar year (which is what most people would do, right?) the 2015 total of 38.4" beat out the 1978 total of 38.1".
Louisville
I will now attempt to make a similar comparison with Louisville's snow days and amounts.
First, let's take a look at the average number of measurable snow days >=0.1"
Averages (# of days):
November: 1
December: 3
January: 4
February: 4
March: 2
During the last 25 years, the most number of days with measurable snow >=0.1" occurred during the period of 2013/14 with 28 days. As far as second place, the 1995/96 and 2002/03 periods registered 27 days.
The least amount of snow days related to measurable snow >=0.1" occurred during 1994/95 with 5 days.
Next, the number of snow days when snowfall was >=2.0".
Averages (# of days)
November: 0
December: 1
January: 1
February: 1
March: 0
Again, the averages come way down.
The most number of days when snowfall exceeded at least 2.0" occurred during the period of 2013/14 with 7 days. Second place went to the 1995/96 period.
Now, there were 5 periods when at least 2.0" were not recorded a single day during the period.
1991/1992
1996/1997
1998/1999
2005/2006
2006/2007
The maximum number of days with significant snowfall of at least 4.0" goes to a three-way tie with 3 days.
The periods are...
1995/1996
1997/1998
2007/2008
Now. the maximum total snowfall recorded during the last 25 years
1) 1995/1996......35.1"
2) 1993/1994......29.9"
3) 1997/1998......29.0"
4) 2014/2015......27.6"
5) 2013/2014......26.0"
6) 2002/2003......24.2"
7) 2009/2010......21.3"
Finally, the least total snowfall recorded during the last 25 years
1) 1991/1992......3.2"
2) 2006/2007......3.4"
3) 1994/1995......4.0"
4) 1996/1997......5.4"
5) 2005/2006......5.7"
Did you know???
Louisville's snowiest calendar year was 1917 when 57.3" was recorded. If you take the top 19 least snowiest years based on the July-Jun periods over the last 100 years (1915/16 - 2014/15), it would add to 58.1".
Hopefully, I can entertain you with other locations in future posts.
MS
Saturday, January 16, 2016
January Mid-Month Report
Is it cold enough for you yet? As I write this post, my temperature here in Valley Station is 32 degrees and cloudy, dreary, blah.
Yet, temperatures are going to tank again, perhaps eclipsing the cold readings we had a few days ago. Single digit surface temperatures and below zero wind chills can be expected late Sunday night into at least the first part of our Monday holiday.
So far, temperatures for the month are running a little above normal for the Louisville, Lexington, and Bowling Green official NWS reporting sites. For the winter season of December through February, everyone is solidly above normal.
Precipitation is running below normal for everyone this month. However, only Bowling Green is now below normal for the winter season.
Among the 3 reporting sites, the highest temperature for the month has been 61 degrees and the lowest has been 9. However, the lowest temperature may need to be adjusted in the next few days.
Snowfall has been meager for Lexington and Bowling Green thus far. Somehow, Louisville ended up with a couple of nice squalls the other day that put down a decent amount of snow in a very short time, then just disappeared since temperatures were near or just above freezing.
The cold air looks to stick around for a few more days, then a moderating in temperatures can be expected. In fact, we may be looking at above normal readings for a consecutive stretch of days. The teleconnection patterns I have been following will be falling out of alignment soon.
The AO will be trending toward neutral, and may even go positive for a time. Similarly, the NAO will be trending toward positive thus losing its grip on keeping any serious cold air that will be funneled into our region. The PNA will still be positive though trending slightly downward during the next several days. That means average to above average temperatures can be expected with this type of alignment.
Here's an interesting part of this report. Now, I am not trying to make a forecast out of this, for there are several arrows the upcoming pattern can follow.
However, I do believe that between now and the first part of February, wintry precipitation of perhaps warning criteria will happen. Now, I say wintry precipitation because p-types for the state may vary.
I have seen when we have had a brutal stretch of cold weather followed by a decent southern stream that lays down a stripe of heavy snowfall or even a thin line of ice for the region followed by a warming trend just a couple of days later.
Could a system for the upcoming week carry out this type of assault on our region? It is possible.
Another scenario. The AO is expected to go back to negative by February. This will help usher in colder air for much of the east coast again. With an increasingly active southern jet stream, perhaps this will be a nice time for cold to settle in while overrunning warmer air from a rich moisture source of the Gulf of Mexico affects us with a variety of precipitation types again. Then we get locked in a cold pattern of longer duration for perhaps up to several days.
I do think this could be the most active part of the winter season between now and the middle of February. So buckle up, here we go.
MS
Monday, January 11, 2016
MikJournal Call for Snowfall
My first official call as I was not impressed by the last system's overall areal coverage, although the amounts were a little more than what I was expecting. Some locations saw over 3". But, that was isolated. Generally 1-2" was pretty common, unless you lived where I do, where I only got 0.5" in Valley Station.
I am using the NAM model for this forecast. But, I understand that this type of northern system often associated with clippers can contain rather robust, overachieving snow bands. The problem is trying to figure out where these convective bands will set up. The models just cannot do that.
Therefore, I will try to broadbrush the amounts but specify where the greatest chances should exist for the highest totals.
I would think WWA's (Winter Weather Advisories) will be issued for areas of Southern Indiana into central and eastern KY. I would not rule out areas to my west like near Owensboro too. Some may be disappointed but others are guaranteed to be surprised.
Let's get to it....
A dusting to 4".
Ok, I know, quite a spread. Go ahead. Laugh it up.
I expect the snow to affect Tell City IN, Owensboro KY to the west and then into central and eastern KY to my south and east.
But, the best chances for higher totals I think exist along the Ohio River from Madison IN, Carrollton KY and then into the Bluegrass near Georgetown KY. Amounts here could realize 1-3", with locally 4" amounts possible.
Tell City IN and Owensboro KY up to 1"
Louisville Metro 1-2"
Frankfort 1-3"
Lexington 1-3"
Bowling Green 0.5 - 1.2"
Several locations east of I-75 between 1-3", locally higher amounts in the higher terrain.
MS
MikJournal Monday 01/11/16
It's safe to say by now we have had our first taste of true Arctic air. A little snow on the ground and generally clear, calm conditions this morning has led to many locations nearing the goose egg mark.
The Arctic Oscillation, affectionately called The Keeper of the Cold, is reaching out and sharing the love. Solidly negative values will lead to perhaps colder readings in the coming days. Why can I say that?
Ah, remember those mild and warm December days of last year? It seems so long ago now that the cold is setting in. But, the AO was solidly recording very positive readings, so that the bulk of the polar winds associated with stormy, low pressure as contrasted with the mid-latitudes confined the coldest air to those areas. Well, this resulted in our temperatures being 20-30 degrees above normal for long stretches.
Now, the conditions have nearly flip-flopped. Solidly negative values, thanks to expansive Siberian high pressure has weakened the Polar Vortex enough that cold air transport is now available for many of us in the eastern U.S. In fact some areas could see readings nearly 25 degrees below average in our region.
The NAO, North American Oscillation, is working in tandem with the AO by providing a nice block for the cold air to arrive here nearly unobstructed.
Think of the recent football games. A running back or wide receiver has the football and is on the move. What better way to get downfield than his teammate throwing a block against an opposing player from interfering with the progress and momentum of the ball carrier. Often, such plays lead to touchdowns.
Well, the cold air is on the move. With nearly no obstructions, the result is Touchdown Cold. And I have a feeling there may be a few more touchdowns before this winter is over.
MS
Sunday, January 10, 2016
First Measurable Snow of the Winter
I have my first measurable snow as of 5:00 this morning January 10, 2016. Just over 0.1" has been realized so far on my snow board. The grassy areas of my yard have a wet slushy whitening.
Radar returns show a rapidly moving backside snow now past Owensboro. I am expecting perhaps 2 more hours tops before tapering off. An inch on average is what I see happening.
UPDATE 09:00 a.m.
I have read several storm reports submitted to NWS offices from Paducah to Wilmington OH.
1-2" amounts were common, mainly along and north of the Ohio River. I saw 2.8" from Orange county IN as the highest amount so far.
At the house in Valley Station, we had 0.5", and that may be quite generous. Still have not seen the official total from Louisville International but would figure less than 1".
MS
Saturday, January 9, 2016
Snow Sense
I have been looking at the models. Do I always rely on models? Only if it makes sense.
I cannot understand how some models are hyping this system into some type of overachiever for our region.
The only places to see something worth talking about is around the area of low pressure, a deformation band capable of spitting out a nice amount over a period of time.
Of course, dry slots accompany these types of systems as well, as St Louis is finding out. Lesser amounts than expected are now being forecast because a dry slot is working in conjunction with a warmer ground where snow is currently falling.
Here, the main low pressure will be far too north of our region to do much of anything substantial.
Are we really relying on overachieving snow showers to carry the bulk of our accumulation? Then, don't expect much.
Between an initial warm and wet ground and a gusty wind, I cannot say with certainty that more than 1" will be realized for most of us in Kentucky as this secondary low passes by quickly.
Right now, the heaviest snowfall I can see happening will be from Louisville to Cincinnati line where 1-2" are possible but probably more like up to 1.5".
MS
Monday, January 4, 2016
MikJournal Monday 01/04/16
El Nino and it's effects so far....
Hilo HI warmest year on record
Portland OR warmest year on record, shatters previous record by 1.2 degrees; wettest December on record
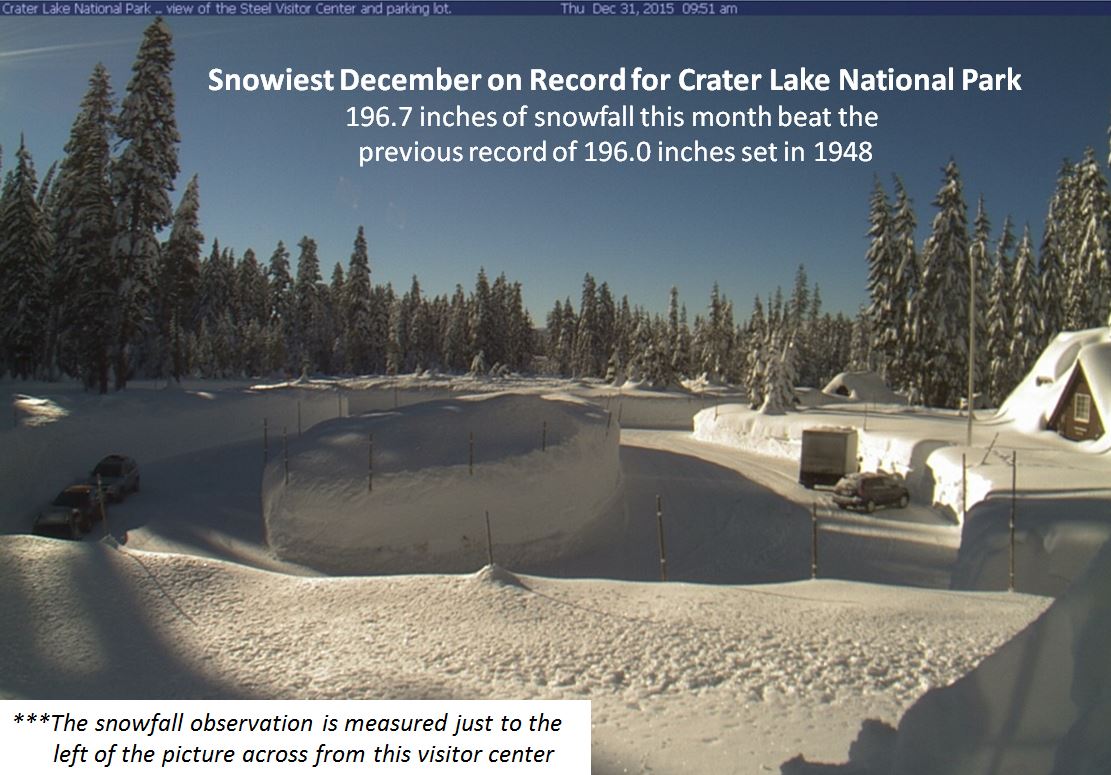
Crater Lake OR snowiest December on record at 197"
26 locations across 10 different states set daily snowfall records for the month of December, including Lubbock and Plainview TX and Roswell NM.
4 of those locations set all-time daily snowfall records, including Bemidji MN with 25" and Friona TX with 18".
21 locations set all-time daily precipitation records for any month of the year during December, including 9.75" at Abbott AR and 9.23" at Moulton AL.
You can argue that El Nino did not cause the events to happen. And you would be right, because El Nino does not cause anything. However, it does influence jet streams, a proven driver that does affect temperatures and precipitation.
Much of the information I have just shelled out to you looks like I have spent hours researching every little morsel of weather information to give to you.
Well, thanks for the compliment. But, the information that I am providing, comes from the National Climatic Data Center (NCDC).
During 2015, the NCDC and two other centers, the geophysical data center and the oceanographic data center merged into one large center called the National Centers for Environmental Information (NCEI).
The merger took place because demand for environmental information preceding 2015 has been escalating.
Presently, the centers combine for more than 20 PB of digital information. I will confess that I am technologically challenged. However, I am getting used to gigabytes and terabytes. But, the petabyte (PB) I have yet to see until now. So, one petabyte is equal to 1,000 terabytes or 1,000,000 gigabytes. Therefore, over 20,000 terabytes of information are available through the NCEI.
Already, there have been noticeable impacts. For example, a long-standing highest temperature record for Colorado of 118 degrees at Bennett has now been changed. It was determined that a typographical transcription error had occurred because area temperatures were 15-20 degrees cooler on that date of July 11, 1888.
Now, Colorado's highest temperature is 114 degrees, set July 1 1933 at Las Animas and tied on July 11 1954 at Sedgwick.
In addition, a state 24-hour precipitation record of 38.70" at Yankeetown FL, set on September 5 1950 has been changed. Since it was an estimate based on a post-storm survey, some even believe it was an underestimate of the actual rainfall, it cannot be considered an official observation from a reliable precipitation gauge.
The new Florida record is 23.28" at Key West on November 11-12, 1980.
Similarly and one of my favorites, is the U.S. 24-hour precipitation record of 43" at Alvin TX on July 25-26 1979. Yes, it has now been changed as well. Since the 43" appears to be estimated during a post storm report, the estimate cannot be used.
Therefore, the observed 42" about 8.5 miles from Alvin will be used, even though the gauge was overflowing at one time, perhaps up to 3" being underreported. Still, the 42" at Alvin continues as a U.S. record.
As you can see, perhaps other records may fall by the wayside as more data becomes available. Again, this is just one of the things we can expect from the newly formed NCEI.
MS
Hilo HI warmest year on record
Portland OR warmest year on record, shatters previous record by 1.2 degrees; wettest December on record
Crater Lake OR snowiest December on record at 197"
26 locations across 10 different states set daily snowfall records for the month of December, including Lubbock and Plainview TX and Roswell NM.
4 of those locations set all-time daily snowfall records, including Bemidji MN with 25" and Friona TX with 18".
21 locations set all-time daily precipitation records for any month of the year during December, including 9.75" at Abbott AR and 9.23" at Moulton AL.
You can argue that El Nino did not cause the events to happen. And you would be right, because El Nino does not cause anything. However, it does influence jet streams, a proven driver that does affect temperatures and precipitation.
Much of the information I have just shelled out to you looks like I have spent hours researching every little morsel of weather information to give to you.
Well, thanks for the compliment. But, the information that I am providing, comes from the National Climatic Data Center (NCDC).
During 2015, the NCDC and two other centers, the geophysical data center and the oceanographic data center merged into one large center called the National Centers for Environmental Information (NCEI).
The merger took place because demand for environmental information preceding 2015 has been escalating.
Presently, the centers combine for more than 20 PB of digital information. I will confess that I am technologically challenged. However, I am getting used to gigabytes and terabytes. But, the petabyte (PB) I have yet to see until now. So, one petabyte is equal to 1,000 terabytes or 1,000,000 gigabytes. Therefore, over 20,000 terabytes of information are available through the NCEI.
Already, there have been noticeable impacts. For example, a long-standing highest temperature record for Colorado of 118 degrees at Bennett has now been changed. It was determined that a typographical transcription error had occurred because area temperatures were 15-20 degrees cooler on that date of July 11, 1888.
Now, Colorado's highest temperature is 114 degrees, set July 1 1933 at Las Animas and tied on July 11 1954 at Sedgwick.
In addition, a state 24-hour precipitation record of 38.70" at Yankeetown FL, set on September 5 1950 has been changed. Since it was an estimate based on a post-storm survey, some even believe it was an underestimate of the actual rainfall, it cannot be considered an official observation from a reliable precipitation gauge.
The new Florida record is 23.28" at Key West on November 11-12, 1980.
Similarly and one of my favorites, is the U.S. 24-hour precipitation record of 43" at Alvin TX on July 25-26 1979. Yes, it has now been changed as well. Since the 43" appears to be estimated during a post storm report, the estimate cannot be used.
Therefore, the observed 42" about 8.5 miles from Alvin will be used, even though the gauge was overflowing at one time, perhaps up to 3" being underreported. Still, the 42" at Alvin continues as a U.S. record.
As you can see, perhaps other records may fall by the wayside as more data becomes available. Again, this is just one of the things we can expect from the newly formed NCEI.
MS
Friday, January 1, 2016
Fun Facts Louisville KY Year in Review 2015
One of my favorite segments is about stuff that, well, really doesn't matter....It's just for fun.
Louisville:
Question: Among the recorded high and low temperatures for each day of the month, what was the most common temperature?
Answer: 68 degrees (24x)
70 degrees (23x)
Question: How does this compare with San Diego CA?
Answer: San Diego
67 degrees (41x)
70 degrees (41x)
Question: How many days was measurable precipitation (>=0.01") recorded?
Answer: 126
Question: How does this compare with Seattle WA, including annual precipitation?
Answer: Louisville 126 days and 62.51"
Seattle 144 days and 44.83"
***An additional comparison can be found on the Big Island at Hilo. Despite measurable rainfall that occurred some 252 days and exceeded normal values by 20.62", at 147.34", Hilo recorded its warmest year on record with 76.1 degrees average temperature. No doubt El Nino had a hand in that one.
Louisville exceeded it normal value by 17.6", but an annual temperature of about 59.4 degrees ranked around 5 or 6 in the top ten warmest years on record.
Question: How many days did Louisville record measurable snowfall (>=0.1")?
Answer: 10. Remember, the snow calendar ran from July 1 2014 through June 30 2015.
***In contrast, Boston recorded 36 days with snowfall measuring at least 0.1" during its record-setting winter season.
Well, this is just a partial summary of the year in review. I may be able to post a few more non-important tidbits in a future post.
MS
Subscribe to:
Posts (Atom)
-
Recently, I noticed that our days have now begun to shorten. However, our sunset here in Louisville still remains at 9:10pm edt. Starting th...
-
 In July of this year, I did a segment about the latest sunsets in the eastern time zone. This corresponded nicely with the summer solstice a...
 -
A 1 Temperature C Humidity F Heat Index 2 81 82 86.82 This is an Excel spreadsheet program. Fairly ...
