Friday, September 30, 2011

If There's Gonna Be Snow...

Wow, can you believe it? That 4 letter 'S' word in the month of October, early October at that. I  will be introducing a new graphic on my blog, along with other traditional methods of reporting snowfall.

Track snow accumulations as they come in...


Although accumulations would only occur in the highest elevations of the Appalachians, it's still fun to hear that snow is already being mentioned in some forecast circles.

MS

Thursday, September 29, 2011

Looking Ahead to October....

The month of October is traditionally a pivotal month meteorologically. Our first frost normally occurs during this time, ultimately leading to a possible end to the growing season by the end of the month when a killing frost can occur.

Also, as I have stated in my Working On the Winter Weather Forecast segments, October is a month to start looking for changing weather patterns that may provide a precursor of what to expect for our upcoming winter.

As you may have been aware, much of Kentucky was experiencing abnormally dry conditions and even moderate drought conditions in some locations.

DateNoneD0-D4D1-D4D2-D4D3-D4D4
09/27/1186.7213.280.040.000.000.00
09/20/1150.3049.7010.650.000.000.00
09/13/1150.3049.7016.140.000.000.00
09/06/1152.2147.7916.550.000.000.00
08/30/1128.8371.1731.024.270.000.00
08/23/1139.8960.1111.600.000.000.00
08/16/1145.0854.925.770.000.000.00
08/09/1183.1816.820.000.000.000.00
08/02/1183.1816.820.000.000.000.00
07/26/1192.867.140.000.000.000.00


The most significant change in this chart is the change in drought status from September 20 to September 27. Notice that nearly half of the state was experiencing at least abnormally dry conditions during the September 20 report. As of the September 27 report, over 86% of the state had been classified as drought-free.

Here is a map of those of us still having abnormally dry conditions...

The CPC has this to say about the 6-10 day temperature outlook. This will follow our below normal readings coming up soon...

This is for Oct 5-9: above normal for us.


And this for its 6-10 day precipitation outlook, for the same October 5-9 period: below normal for us.


This should get us through the first 10 days of the month. Not too bad, really.

For the near term, I'm still questioning whether the bulk of the cold air will be as bad here in Louisville as it will be just to our east. I do see high temps struggling to get out of the 50's either Saturday or Sunday. Yet, cloud cover may keep our overnight lows from bottoming out too much, perhaps in the 42-46 range.

However, to our east, if skies clear enough, frost will become an issue for them, with temps reaching the mid to upper 30's. Best chance of this is across far eastern Kentucky. Even with cloud cover, temps may still dip into the upper 30's in these areas.

More updates coming later or as they become available.

MS

Tuesday, September 27, 2011

Canadian Areas Warmer Than We Are

It really is something to see what a difference some cutoff low can do for you. Our temperatures have been well below normal here. Temps did reach the low to mid 70's in places. However, in west central Canada, they're experiencing temperatures just as warm, thanks to a building ridge.

That ridge will move east and give us a nice, warmer afternoon for Thursday, possibly upper 70's to near 80.

Then, the next shot of cool air will dive into the region with the coolest readings of the young Fall season.


Click on the map above and follow the warmth...for now.

MS

Working On the Winter Weather Forecast PART 2 - October/November 2000 Data

In part 1, I discussed the data from the Jan/Feb 2000 Winter, primarily because we were in the grips of an impressive La Nina then. You can review the data from accessing the archived posts of September 17 2011.

However, you may be asking, what role would this play in our upcoming winter of 2011/2012?

I introduced the early 2000 data to show what impact a strong La Nina produced. Seemingly, the data correlated somewhat better than I imagined with a typically strong La Nina. Later, though, that La Nina began to fade, but did return later in the year. This second La Nina would not be as strong as the previous one. Therefore, one would expect that the data correlation would not be as favorable.

In my previous post discussion about the Winter Weather Forecast for 2011/2012, I mentioned how I would research the October 2000 data in order to determine any specific weather pattern that could help figure out how the winter of 2001 and La Nina's impacts would unfold. Then, hopefully, this would shed some light on how winter of 2011/2012 will  be.

Well, here's what I found.

First, the latter part of Summer 2000 saw above normal temperatures for our region. Sound familiar(FF to 2011)? Then, the month of September featured below normal readings. Looks like we'll finish September on a below normal basis as well. October saw temperatures above normal for much of the central U.S., including Kentucky. So far, the Climate Prediction Center is forecasting above normal readings for much of the central U.S for our October 2011. 

However, I really could not find a specific weather pattern change that could help us figure out how the upcoming winter of 2001 would fare...at least in October. There were some subtle introductions of colder air pouring into the northern parts of the Intermountain West region by the end of the month, but not the definitive, season-altering pattern shift (what I like to call SAPS) that I wanted to see.

Therefore, I needed data from the month of November. Finally, by the 6th of the month, a significant display of cold air began intruding the far northern areas of the United States via the Arctic regions. Our part of the country actually held onto the warmer air for a while. But, by the 9th of the month, it was obvious, our warm readings wouldn't make a return.

We weren't the only ones experiencing the cold stuff...Check out this graphic for November's temperatures:


November 2000 proved to be the 2nd coolest month on record for the United States.

As far as precipitation, first, I wanted to show this map of the 'snow cover anomaly map'. This shows where much of the country experienced snowfall amounts not normally seen like this during the month of November:


Overall, precipitation would prove to be greatest in the midsection of the country for the month.

Again, I just want to remind readers that I'm NOT suggesting this is how weather events will work out for our winter of 2011/2012. La Nina II was really just getting going by then. Also, all weather is interrelated. I try and look at how the rest of the globe was faring, again, hoping to find trends as to how our winter MIGHT go.

Here's a look at what I'm talking about...


With this snow cover anomaly map for Europe and Asia, can you tell where areas were perhaps warmer and colder than normal?

Let's see how you did. Here's the surface temperature map. Some data may be missing, but you get the picture...


For those of you who are interested in numbers for other variables that could contribute to winter weather, here is a look at those numbers...for November 2000.

NAO  (-0.92)
PNA   0.74
AMO (-0.015)
PDO (-0.53)
ENSO Oct/Nov/Dec (-0.6) La Nina conditions
AO (-1.581)

In my next segment, I will be looking at how the rest of the winter 2000/2001 progressed based on the SAPS test, La Nina conditions, and the other variables.

You can also look at some of the data I've been looking at by visiting the HPC website's 'Daily Weather Map' section HERE.

MS


Add Another One to the Record Books

September 2011 has now become the 9th wettest one on record at 5.72". With another shot at rain about midweek, we could easily move up into the 7th position.

Supporting an unusually wet year, we have also had the wettest April on record and the 9th wettest June.

Remember, we have already breached our average precipitation for the year; 44.91" is the latest average annual statistic I have on file. We actually surpassed that on August 7.

At 52.79" for the year, we only need 3.53" to break into the top ten wettest years on record.

MS

Monday, September 26, 2011

Wow...Talk About Drought-Busting!

Did someone say we were under some type of drought??? Uh...all I know is that I was under some type of cloudburst that even the Energizer bunny would have a hard time keeping up with.

Check out some of these rainfall totals during the past 24 hours...(these are unofficial)

At my location in Valley Station - nearly 3.50"
Louisville Int'l - 3.36"

Here are some from the volunteer network CoCoRaHS...
Enlarge the map above and see some locations nearby your place. Overall, our region had some of the heaviest 24-hour rainfall totals, again, unofficially.

Other rainfall totals from MSD rain gauges...
ID
Site
Rainfall
Daily
Rate
Total
(in./hr)
(inches)
TR01
D. R. Guthrie WQTC
0
3.43
TR02
PRP Fire Station Training Facility
0
3.92
TR03
Shively PS
0
3.77
TR04
Morris Forman WQTC
0
3.9
TR05
Beargrass Creek PS
0
3.77
TR06
Hite Creek WQTC
0
1.91
TR07
Floyds fork WQTC
0
1.17
TR08
Fern Creek Fire Station #3
0
1.15
TR09
Cedar Creek WQTC
0
1.24
TR10
Camp Horine (Jefferson Co. Forest)
0
2.37
TR11
Northern Ditch PS
0
2.72
TR12
Nightingale PS
0
2.98
TR13
St. Matthews Elementary School
0
2.36
TR14
Lea Ann Way PS
0
2.11
TR15
Jeffersontown WQTC
0
1.03
TR17
Mt. St. Francis
0
0.5
TR18
IVY Tech
0
1.67
TR19
Fairdale High School
0
2.66
These totals above represent amounts since midnight.

MS 

Noisy Storms in Louisville

1:45am LAST update
Winding Bluff Trace - residential fire alarm, water leaking from ceiling near the Brownsboro rd area and Watterson X-way

Over 4,000 outages in Jefferson county

More heavy rain moving back into the area...
From NWS Louisville - Flood advisory
AT 132 AM EDT...LOCAL LAW ENFORCEMENT OFFICIALS REPORTED SEVERAL
ROADS FLOODED...INCLUDING FLOYD ROAD AT SEVERAL INTERSECTIONS.

DOPPLER RADAR HAS INDICATED THAT AREAS OF JEFFERSON COUNTY WEST OF
INTERSTATE 65 HAVE RECEIVED THE HEAVIEST RAINS. LOCAL GAGES HAVE
INDICATED THAT UP TO TWO INCHES OF RAIN HAD FALLEN OVER THE PAST 2
HOURS NEAR DIXIE HIGHWAY AND SHIVELY.

ANOTHER LINE OF STORMS WITH HEAVY RAIN WILL APPROACH THE WESTERN
LOUISVILLE METROPOLITAN AREA BY 2 AM EDT. ANOTHER INCH IS LIKELY
ACROSS MUCH OF JEFFERSON COUNTY.

1:35am update
tree on house at Sheperdsville rd


1:25am update
Over 3,900 in Jefferson county without power, mostly in the 40219 zip code or the Okolona area.

1:20am update
Rain totals here in Valley Station over 1.5" now, most of that occurring with this line of storms pushing through during the last hour.

Severe T'Storm warning for Jefferson county

1:10am update
Fire officials say nothing showing at Morton ave.
Farnsley Rd - electrical box fire
Winds are picking up here at my location...

1:00am update
So far, no reported house/business fires as of 1:00am...As I'm typing this, an electrical structural fire being reported near Barrett ave and Edwards St at Morton ave. Sounds like an electrical box.

Now, a residential fire in Valley Station at 11000 block Pierce Way in Leemont Acres

12:55am update
Many security alarms being tripped. Fire officials having to respond...

12:50am update...
2814 S Third St - Transformer fire, sparks along wires down toward the stadium
------------------
Ok, I'm awake. I was asleep, but no more. That was some intense lightning a few minutes ago. At 12:40 am, about 100 customers in Valley Station with no power, mainly due to lightning. My lights flickered, messed up the alarms, etc....Now, the heavy rain is moving in.

Pleasure Ridge Park is also reporting outages, a little less than 100 now. As far as Jefferson county goes, the number is over 300. That number should rise as long as the lightning remains this intense.

Checking for housefires on scanners this morning. Updates may be forthcoming.

MS

Sunday, September 25, 2011

Flash Flood WARNING - E'ville Indiana

Evansville IN has seen quite a bit of rain since midnight on September 24. Now with at least 4" during this time frame, the ground has exhausted its ability to soak up any additional rainfall. Any heavy rains (including the heavy rain now falling as of 9:30pm edt, will result in runoff and additional flash flooding.

Nearby Gibson county is experiencing high water issues as well, with requests to avoid SR 64 just west of SR 57.

Also, nearly 2000 Vectren customers are without power at this hour according to ABC News 25 in Evansville and surrounding communities.

Following police scanners at the moment. Will report anything significant if it occurs.

MS

Friday, September 23, 2011

UARS Predicted Landing (at least my opinion)

FINAL UPDATE SEPT 24 10:20PM
Well, I missed re-entry by about 2.5 hours. Therefore, my projected splashdown was missed by at least the length of the United States. Still not a bad guess, but I think I'll stick to horseshoes.
-------------------------------------------------------------
Ok, nobody wants to hazard a guess. So, I'll give my 2 cents worth.

I'm looking at an area of the North Pacific Ocean 400 miles west of South America to 150 miles north of Honduras. Completing the eastern part, I've included parts of Venezuela and Brazil north to areas of the Caribbean near the Windward and Leeward islands.

Anyone else got a guess???

MS

Dead Satellite's Plunge - Interesting Developments

Just when they (NASA officials) thought North America will NOT be impacted by the UARS' fall to the Earth, the slowing descent and orientation may prolong re-entry long enough to get a bit closer to our neck of the woods after all.

I still think John Belushi, from Saturday Night Live, discussed falling satellites perfectly, in his skit and rant as the old Skylab satellite was poised to re-enter the earth's atmosphere...


Update #10

Fri, 23 Sep 2011 10:45:08 AM EDT

As of 10:30 a.m. EDT on Sept. 23, 2011, the orbit of UARS was 100 miles by 105 miles (160 km by 170 km). Re-entry is expected late Friday, Sept. 23, or early Saturday, Sept. 24, Eastern Daylight Time. Solar activity is no longer the major factor in the satellite’s rate of descent. The satellite’s orientation or configuration apparently has changed, and that is now slowing its descent. There is a low probability any debris that survives re-entry will land in the United States, but the possibility cannot be discounted because of this changing rate of descent. It is still too early to predict the time and location of re-entry with any certainty, but predictions will become more refined in the next 12 to 18 hours.

MS

Thursday, September 22, 2011

Weather and Not The Weather

I decided to combine the weather features along with non-weather items this go around. Seems like I've been focusing quite a bit on the impending impact of the UARS somewhere on the planet.

By the way, I don't have the latest update. However, I did come across this fascinating statistic:


Each dot represents a bit of known space junk that's at least 4 inches (10 cm) in low-Earth orbit, where the space station and shuttles roam. In total, some 19,000 manmade objects this size or bigger orbit Earth as of July 2009; most are in low-Earth orbit. Countless smaller objects are also circling the planet.
CREDIT: NASA/Orbital Debris Program Office

By the way, hopefully, this will break the stress of whether anyone will be ultimately impacted by the falling satellite. Check this old Saturday Night LIVE clip of John Belushi, the "science editor", discussing the impending fall of the SkyLab satellite.


-----------------------------------

The death toll has now surpassed 100 following the major earthquake that struck India last Sunday. The rescue efforts have been hampered by persistent heavy rains. Click HERE for more information.

-----------------------------------

Speaking of earthquake news, Seattle WA has recorded a minor earthquake on the order of 3.2 just a little earlier this afternoon. Some residents may have felt it, but no damage was expected to be reported.
"The U. S. Geological Survey intensity website indicates it was felt as weak-to-light shaking to by a few dozen respondents, mostly in the North Bend-Snoqualmie area." - komonews.com
-----------------------------------
Now, for the weather...
All indications point toward another one of those pesky cutoff lows that will be hanging around like a fly ready to be swatted into the next century.


FOR TONIGHT...CONSENSUS OF THE SHORT RANGE MODELS AGREE THAT UPPER
TROUGH OVER THE UPPER MIDWEST WILL DEEPEN CONSIDERABLY AND THEN

CLOSE OFF.

FOR FRIDAY...UPPER TROUGH SHOULD BE CUT OFF BY THIS TIME WITH ITS
PLACEMENT SOMEWHERE OVER NORTHERN ILLINOIS OR SOUTHERN WISCONSIN. EXPECT MOST OF THE PRECIPITATION TO END BY THE AFTERNOON
HOURS WITH PARTIAL CLEARING WORKING IN FROM THE WEST TO THE EAST.
THIS CUTOFF LOW IS STILL EXPECTED TO AFFECT THE FORECAST AREA THROUGH THE WEEKEND AND INTO NEXT WEEK. HOWEVER, AS MENTIONED IN THE PREVIOUS DISCUSSION, THE LAST COUPLE MODEL RUNS PLACE THIS FEATURE WELL WEST OF WHERE YESTERDAYS MODEL RUNS HAD IT. THE CENTER OF THIS LOW IS NOW EXPECTED TO BE OVER NORTHERN IL/IN THROUGH THE WEEKEND.
Rainfall amounts for the entire period still look like about an inch or so.

MS

Dead Satellite NOT To Affect North America

The time is getting perilously close for re-entry of the UARS.

However, even though scientists still are not sure where the dead satellite will end up, they have ruled out North America as a possible impact zone.

This is according to Space.com:

"Re-entry is expected sometime during the afternoon of Sept. 23, Eastern Daylight Time," agency officials said in a statement. "The satellite will not be passing over North America during that time period. It is still too early to predict the time and location of re-entry with any more certainty, but predictions will become more refined in the next 24 to 48 hours."

MS

Wednesday, September 21, 2011

Dead Satellite Re-Entry Update

2:00pm UPDATE Sept 21

Whoever is able to view the falling satellite upon re-entry is in for quite a light show. It's supposed to rival that of a spectacular fireworks display, not like a fireball meteor, which only lasts for a few seconds.

Here's a snippet from Spaceweather.com:
"The disintegration of UARS is expected to produce a fireball that could be visible even in broad daylight. Not all of the spacecraft will burn up in the atmosphere, however; according to a NASA risk assessment, as many as 26 potentially hazardous pieces of debris could be scattered along a ground track some 500 miles long. The same report puts the odds of a human casualty at 1 in 3200."

-------------------------

I will be covering this more frequently, especially as the satellite comes closer to re-entry.

Here's the latest:

Latest NASA Update:
"As of Sept. 20, 2011, the orbit of UARS was 127 mi by 140 mi (205 km by 225 km). Re-entry is expected Sept. 23, plus or minus a day. It is still too early to predict the time and location of re-entry. Predictions will become more refined over the next two days."

Stay tuned...

There are a lot of science websites that are tracking this developing story.

I obtained the above quote from Space.com. However, feel free to check out NASA's site. It would be neat if they could track this satellite on NASA TV as it makes re-entry.

MS

Sunday, September 18, 2011

Will Our Drought Intensify???

Parts of the region have experienced some drought conditions that some analysts believe may intensify over the next several weeks. This map was released September 15 and shows parts of the region, especially central and southern Indiana and parts of north-central Kentucky, experiencing an anticipated worsening of drought conditions.


In addition, a preliminary outlook for the month of October shows a large swath of the country experiencing below average precipitation...


Let's hope the rains over the next couple of days will bring us some modest relief. Let's also hope that the CPC will revise their forecasts for a wetter pattern instead

Also, to keep you posted, I'm working on an extensive winter weather project. My official winter forecast won't be coming out till early November. However, I will be presenting a series of archived data with explanations.

Perhaps you already have other variables you'll be looking at. My perspective will offer an unbiased look at the last back to back La Nina so that we can pick up on any similarities.

I will be focusing my research on the latter part of 2000 into early 2001 time frame.

MS

Saturday, September 17, 2011

Working On the Winter Weather Forecast 2011/2012 - PART 1 (Jan/Feb 2000 Data)

The above map is the daily January 2000 snow cover map. You kinda get an idea of how the weather pattern unfolded.


Next is the daily February 2000 snow cover map above. Note how the leftover snowfall melted early in the month and never returned, denoting generally above normal temperatures.

---------------------------

As far as temperatures for January 2000 were concerned, here is a nice graphic for that:

According to the National Climatic database, here is a brief breakdown of the following weather patterns for the month:

The month began with a ridge dominating the eastern third of the country and an upper-level trough over the west. This trough quickly moved to the northeast only to be replaced by another. Around 10 January, there was a pattern shift and the western third of the country came under the influence of an upper-level ridge while the east was dominated by an upper-level trough with the mean axis just off the Atlantic east coast.

------------------------------

For February 2000, precipitation pattern proved to be above normal as denoted by this graphic:

And the February 2000 temperature pattern was just as robust...
Check this map out below.


Again, the National Climatic database had this to say about the weather pattern for February 2000.

The upper-air pattern remained progressive and active for most of the month with several deep, storm-producing troughs crossing the country from west to east. Pacific-borne systems dominated the month with limited intrusions of cooler arctic air.
A mean upper-level ridge in the central portion of the country provided warmer than normal temperatures from coast to coast with much warmer than normal temperatures from the central Rockies to the Ohio Valley and from the western Great Lakes to Texas.

This is just Part 1 of my series on forecasting the winter weather forecast for 2011/2012. I'm using the archived data from the Jan/Feb 2000 winter.

In future posts, I'll be presenting data from September 2000 - March 2001. This is the last time we had a significant back to back La Nina episode.

While I'm not saying events will happen exactly as then, it will be interesting to see how the overall weather pattern develops. Watch for these patterns as early as October.

Therefore, in Part 2 of my next Winter Weather discussion, I'll be looking at the overall weather pattern for the month of October 2001 in particular.

MS

Sherman Minton Alternative Route Maps - Ky Transportation Cabinet

For those interested, this site is from the Kentucky Transportation Cabinet listing 3 alternative solutions for navigating the roadways as the Sherman Minton bridge undergoes eventual inspections and repairs.

<CLICK HERE>

MS

Thursday, September 15, 2011

Hurricane Maria Heading For Newfoundland

Hurricane WATCH for Newfoundland from Arnold's Cove to Brigus South.

File:Newfoundland map.png

Expected to affect southeast parts of Newfoundland.

Hurricane WARNING may be issued later.

MS

Cold Septembrrrr Day

Well, after all of the recent warmth we were just getting used to again, this shot of cool air feels well, cold.

Dewpoint temperatures are plummeting, now down in the mid 30's. With brisk northerly winds and a rapidly drying airmass, the 65+ degree temperatures we're experiencing right now doesn't feel like 65.

Speaking of cold, I checked in with International Falls, MN, the 'icebox of the nation'.
Here is what one NWS product put out earlier today:

1st Recorded Temperature in the Teens for the Month of September at International Falls
The low temperature at 7:06 am this morning at International Falls was 19 degrees. This breaks the record low  for a September 15th, 24 degrees, set in 1964. This is the coldest temperature reported for so early in the season. This also marks the first time in station history that a temperature in the teens has been recorded in the month of September.


international falls, minn

Other media outlets are recognizing this early chill for our nation's 'icebox'.
Here's one from LIVE SCIENCE

MS

Tuesday, September 13, 2011

Fall Weather Roundup

Before we get into the Fall part of my post, how about those 90's? First time all month we've recorded a high in the 90's. At 4pm, temp at Louisville Int'l is 92. Same here at my house in Valley Station.

HIGH TEMPS
100's - 3
90's - 1
80's - 4
70's - 0
60's - 5

However, the warm temps are getting ready to take a back seat...again.

Hopefully, some beneficial rains for the region. The models are offering these for amounts at this time on Wed/Thur.

18zNAM - 0.51"
12zGEM - 0.63"
12zGFS - 0.16"

And did we mention cooler temps???

By Thursday, with sun, expected temps in the mid 60's. If clouds hang around, mid to upper 50's.
Lows will likely dip into the mid 40's by Thr/Fri morning. Nice taste of Fall.

An experimental low-temperature projector...
Keep an eye on International Falls, MN's low temperature for Thursday morning and Louisville's high temperature for Thursday. Add the two together and divide by two should yield an approximation of our low temperature for Friday morning. Unfortunately the heat island effect could skew my results. But some in the area will see the lows I'm looking at for the Louisville surrounding area.

International Falls MN expected low Thr am - 23
Louisville KY expected high Thr pm - 66

Add the two together, we get 89. Divide by two and we get 44.5 degrees for low temp on Friday in Louisville. Based on this forecast, some in the region, especially east and north of Louisville could see lows dip in the upper 30's.

MS

Sunday, September 11, 2011

More High Drama in Texas

UPDATE2
Fire has been controlled...Several homes were threatened but none apparently burned. Some engine companies still on site.

Great job guys and gals!

Click HERE for details.
-----------------------------------------

<font color=990000>BREAKING: </font>Fire near San Antonio airport; homes being evacuated


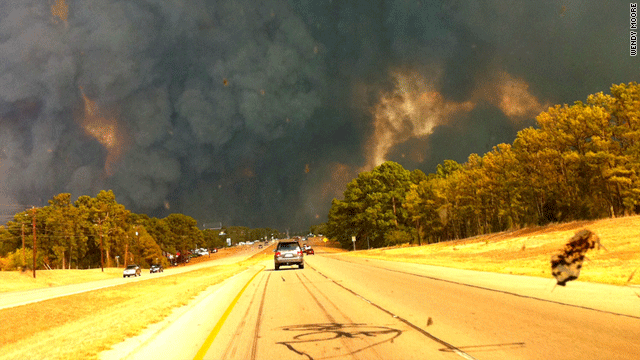
At 3:00pm, following more high drama in parts of Texas regarding additional wildfire outbreaks.
----------------------
UPDATE1
Firefighters seem to be getting upper hand on some of this, however homes still in danger. Not too far from airport.

Here's a map link...[CLICK HERE]
Listening to some animated dispatches on police scanner frequencies, this one in San Antonio. Large brush fire affecting area. At least 5 homes in danger on one street. Other homes being threatened.

I'll provide updates as needed.

Here are the channels I'm following...

San Antonio Police and Fire

MS

Friday, September 9, 2011

Update On San Diego Power Outage

All 1.4 million San Diego Gas & Electric customers lost power yesterday afternoon. In fact, a large portion of the West lost power affecting up to 5,000,000 residents, according to estimates.

The power disruption apparently rendered some sewage pumps inoperable, causing sewage to spill onto beaches. In fact, some beaches north of Scripps Pier through Del Mar and Solano beach were shut down.
Today, power has been restored to most if not all residents in San Diego.

While the official cause of the outage will be under investigation, several sources are pointing to human error as work was being done at a power substation in Arizona.

MS

Arctic Areas Warmer Than Louisville???

I've observed a few breaks in the stubborn cloudiness today. Hopefully a sign of things to come. The temperature at my location has finally touched 70 degrees as of 2:30pm.

However, temperatures in the upper Plains are soaring well into mid and upper 80's as of this hour.

In addition, temperatures as far as 60 degrees north latitude (Louisville at 38 degrees north latitude) at Hay River, Northwest Territories is reporting temperatures in the mid 70's at this hour. Amazing!

MS

Thursday, September 8, 2011

NASA News...Defunct Satellite Set to Re-enter Earth's Atmosphere By End of the Month

Although most of the satellite will burn up upon re-entry, some pieces are expected to survive the process. At this time, the exact time of re-entry and location of possible areas affected are not known. More updates will be provided as necessary from NASA.

According to NASA, the risk to public safety or property is extremely small.

Just giving you a 'heads up'.

MS

Downtown Binghamton NY Ordered to Evacuate

2:55pm
Emergency personnel could not reach NYSEG in time, fire has now broken out at McArthur school due to water rushing into building.
-----------------------------
2:45pm
Sounds like quite a few electrical fires breaking out as waters enter schools and businesses. Don't know if power company is going to cut power to downtown or not...more on that later.
------------------------------
2:10 pm UPDATE
Water rescues in progress, especially for homes where residents did not earlier heed evacuation orders. According to emergency personnel, waist-deep water being reported in neighborhoods.
--------------------------
Here are some pictures from earlier...


1:55pm edt
UPDATE
According to WBNG weather...
"History is being made across the Twin Tiers. For the last 5 years people, and media alike, have referred to 2006 as the benchmark by which we judge flooding along the area rivers. I believe that will change and we will be referencing 2011 from this point forward. Historical river crests are forecast along portions of the Susquehanna and Chenango Rivers. As far as the details, hardest hit areas have received 5-12” of rain since early Wednesday morning. "
----------------------------------
1:45pm edt
Another brief update...
Tractor-trailers trying to turn around on bridge, causing a huge traffic problem

Also track nearby Vestal NY's river gauge, also at historic highs HERE.

I've included a Binghamton NY map.  Click For Map

BRIEF UPDATE///
Gas is leaking...concern about possible ignition sources could cause a fire. Trying to contact gas company to shut it down.

Meanwhile, follow the river's rise in Binghamton HERE.
-------------------------------------------------------
Following police scanners early this afternoon. The main drama appears to be an imminent evacuation of residents and businesses in the downtown district of Binghamton NY. Roads are being ordered closed as the Susquehanna river is breaching the flood wall...

From FOX 40 \WICZ

"No access into downtown Binghamton only vehicles leaving city. No one will be allowed into the downtown area. *Individuals looking for family members can call Binghamton University Events Center at 888-787-0540 *All bridges are closed in downtown Binghamton effective immediately. *All City of Binghamton events canceled. *Residents in the Twin Orchards area of the Town of Vestal are in immediate danger of imminent flooding. The Susquehanna River is overflowing the flood wall near Vestal Road. Residents in this area need to evacuate now."

"I believe this will be a flood of historic proportions when all is said and done," Gov. Andrew Cuomo said, according to Gannett reporters based in Albany.

The river has now set an all-time record high.

More updates coming soon...
Follow updates below:

WBNG

WICZ.com

MS

Wednesday, September 7, 2011

Timeout...Let's NOT Talk Weather

When you experience 3 consecutive days of clouds, rain/drizzle, and well-below normal temperatures, don't complain, just change the subject.

On this day....

1813 - The nickname "Uncle Sam" was first used as a symbolic reference to the United States. The reference appeared in an editorial in the New York's Troy Post.

1930 - The cartoon "Blondie" made its first appearance in the comic strips.

1971 - "The Beverly Hillbillies" was seen for the final time on CBS-TV.

1979 - ESPN, the Entertainment and Sports Programming Network, made its debut on cable TV.

Okay, I can't help it...gotta talk 'a little bit' about weather...

1991 - Calgary had its costliest hailstorm on record with 350 million dollars of insured losses.
--------------------------------------------
Here's a breakdown of September's bizzare and unique holidays...

Classical Music Month
Hispanic Heritage Month
Fall Hat Month
International Square Dancing Month
National Courtesy Month
National Piano Month
Baby Safety Month
Better Breakfast Month

Today is "Neither Rain Nor Snow Day'

....And no, it's not talking about the weather.

Actually, it's a partial inscription found on the New York Post Office building at its opening in 1914 on this day.

The building, bearing the inscription: "Neither snow nor rain nor heat nor gloom of night stays these couriers from the swift completion of their appointed rounds," is a national historic landmark, and occupies two full city blocks.

Interestingly, this inscription is often mistakened as the official motto of the United States Postal Service.
The USPS does not have an official motto.

We'll talk about weather later....
MS

Tuesday, September 6, 2011

Scarred Earth...Palo Pinto county TX

Take a look at this view from space of some of the burned areas in Texas...


The gray area represents burned areas from recent fires in Texas.
This picture of Palo Pinto county.

Read the article HERE.

MS

Let's Talk Winter 2011/2012

I'm not ready to issue my winter outlook yet. However, some are already going out on a limb and offering their prognostication (fancy word for luck?) for the upcoming winter.

Here's one of many to come...

From the Farmers' Almanac:


For a detailed discussion of their winter forecast, click HERE.

Select Rainfall Totals For Eastern KY thru 7:00am

These reports are from your neighbors of the volunteer network, CoCoRaHS. You may have heard of them. I'll provide the link below after these reports.

These are for the past two days...and randomly selected from reporting counties of primarily eastern KY:

Thru 7:00am this morning...

Casey - 4.53"
Boyd - 3.51"
Madison - 3.38"
Jackson - 3.20"
Wayne - 3.20"
Fayette - 3.08"
Woodford - 2.88"
Laurel - 2.82"
Jessamine - 2.81"
Boyle - 2.62"
Breathitt - 2.59"
Clark - 2.44"
Floyd - 2.13"
Estill - 2.08"
Rockcastle - 1.97"

Did you see your county above? How much did you receive?

Why not join the growing list of weather volunteers at CoCoRaHS?

Although the reports above are not 'official', the National Weather Service uses these in their reports when compiling precipitation totals.

Personally, I'm planning on becoming a volunteer this upcoming winter. The more reports from each county, the better.

Here is the link below:
http://www.cocorahs.org/

Or 'google' it to find out more....

MS

Sunday, September 4, 2011

Following Police Scanners - Austin Metro (TX) Fires and Cessna Downed in Wildfire (Los Angeles county CA)

The largest of the fires whipping through central Texas is in Bastrop County, shown here on Sunday.

Strong winds have whipped up several more fires in Texas, most notably one just southeast of Austin in Bastrop county. Last I heard, firefighters were trying to save a residential area.
Updates can be found HERE.

In addition, just got word of a Cessna went down in a wildfire in Los Angeles county CA. Reports are somewhat sketchy at the moment, but reports are saying a Cessna 210 plane crashed in Blackburn Canyon killing one and ignited a fast-moving brush fire that has already grown to 750 acres as of this post. This is northeast of Los Angeles. A mandatory evacuation of 30 homes has been ordered.
Follow updates at this site here.
Also on this police scanner...here.

MS

Flash Flood Update

Flash Flood Warning for SE Lawrence county in KY and south-central Wayne county in WV.

According to NWS, no flooding has been reported, but with more rain moving in on top of radar-estimated 2-4", some problems may arise.

MS

Woodford County KY Power Outage Update

Strong storms rocked parts of the Bluegrass early this evening knocking out power to several residents, especially around the Versailles area.

As of 8:15pm edt, Woodford county is reporting close to 2,200 outages according to KU/ODP.
In Harlan county, less than 50 outages now being reported and Fayette county has a little less than 350.

In Versailles, numerous trees down and high water even closed roads for a time.

MS

Lee's Rain UPDATES Louisiana, Alabama

Updated at 11:30am edt...
HOLDON              13.93
N.O. CAROLLTON      12.97
MAUREPAS            11.97
CONVENT 2S          11.55
GALLIANO            11.40
LIVINGSTON          11.24
N.O. AUDUBON        10.79
SLIDELL CITY        10.62
PASCAGOULA          10.60
COVINGTON           10.46
TERRYTOWN 3S         9.86
PONCHATOULA 4SE      9.42
BAPTIST              9.31
MS

Watching the Rain Here...

Keep up with the latest daily totals
Enlarge map by clicking on it...


I've provided a few webcam shots below....
 Lexington

Pikeville, Kentucky - Eastern Kentucky Expo Center 1 Webcam
Pikeville

Ashland
 
Huntington WV
 
Projected rainfall amounts for the area...for 8am Sun - 8pm Tue

MS
 

Model ALERT

We as weather enthusiasts should never take an individual run of the models and say that's what's going to happen. However, I would like to share one of my favorite models with you and the possible setup. This is just for Tuesday morning...

Click on the map and take note of the lower right quadrant. Precip amounts are expressed in "millimeters".
10 mm = 1cm
25.4mm = 2.54cm=1 inch

Some locations in eastern KY are expecting at least 3" during this time. Total amounts may exceed 5-6" in some locations for the upcoming week.

This model and its trend has shifted a little farther west than previous runs. Perhaps either the front is moving slower or Lee is moving faster. However, consistently, eastern KY has been in the bullseye of the heaviest rainfall.

More updates later...
MS


What's That Falling From the Sky???

For many of us, rain has become a foreign word in our weather vocabulary...
It's been so long, I had to look up the meaning.

According to the NWS, rain is defined as "Precipitation that falls to earth in drops more than 0.5 mm in diameter."

So for you who haven't seen this phenomena in a while, you won't need to be overly concerned and clog the 911 emergency lines as this rain begins to fall.

Seriously, the rain, while welcome, may seem to over-extend its stay in some locations, compliments of Lee and a lazily moving but potent cold front.

Depending on where the moisture pools, some areas, especially in parts of eastern KY will receive at least 2-4". I expect higher amounts in far eastern KY with all of the orographic lifting. I wouldn't be surprised by some 6" amounts, which may lead to some possible flooding concerns.

The models that I look at are not in agreement about precip amounts. However, they do agree that the bulk of the precip will be further east than Friday and Saturday's forecast. That trend may continue.

However, we need to wait and see how the front and Lee will mesh.

Louisville, or parts of the area, should receive at least an inch of rain, perhaps 1-2". Rainfall amounts in general should be heavier the farther east one travels.

Hopefully, although it's bad timing, everyone will get in on the rain that we desperately need. But, I do know that everyone will benefit from the cooler readings in store for nearly all of next week.

MS

Friday, September 2, 2011

abc...KLM...xyz

After another brutal day of 100-degree heat scheduled for today and tomorrow, big changes are looming. As reported here last week, I mentioned the below-normal temps expected from Labor Day onward thru the rest of next week. That looks to be the case for a certainty.

Here are a few reasonable explanations for the below-normal readings coming up...I call it the ABC's of next week's forecast.

First, look out for Hurricane Katia. It looks to make a trek uncomfortably close to the U.S. East coast later in the week. As the storm system approaches, counterclockwise flow around the tropical low will keep our temps in a east to northeast flow, which does not translate to above-normal readings.

It is still too early to tell whether Katia will spread any precipitation onshore or over the Appalachians toward eastern KY, however the possibility does exist. But, an increasing threat will be whether Katia affects the northeast with any more rain.

This leads us to the next letter of our alphabet, Lee, yes, tropical storm Lee. It is expected to be a slow mover as it traverses the southern landscape. Some expected precip amounts are in a drought-busting range of 10-16" for areas like Louisiana and Mississippi.

Lee's affects could be the Major(s) (get it Lee Majors....uh...right) in terms of rain producers and may be felt within the region as well. Depending on how much dry air is sucked into the system from the behemoth high pressure ridge standing put over Texas, heavy rains could impact the region by the end of the weekend. The forecast models are showing copious amounts along and east of I-65, perhaps up to 6" in places. Again, this will be watched closely, as atmospheric dynamics could alter Lee's moisture supply. This will also keep our temperatures down with all the cloud cover and possible rain and an associated cold front poised to push through as well.

Unfortunately, Lee's effects may be felt along the northeast coast later in the week. This is not a good scenario as either Katia and/or Lee could affect those residents with more rain.

Last, the Models are showing a consensus for below-normal readings. Most forecast models show temps generally in the mid-70's to the low 80's. However, some days may struggle to reach the mid-70's if we get the generous rains here in Louisville. Most likely, areas in eastern KY will receive the brunt of the rain and cloud cover along with temps not able to get above 70.

And that's your ABC's for next week. Stay tuned...

And, by the way, speaking of ABC, remember Lee Majors' role as Steve Austin in the Six Million Dollar Man away back in the 1970's? Couldn't help but think of him as tropical storm Lee approaches the Gulf coast.  
The Six Million Dollar Man TV Intro
http://www.youtube.com/watch?v=HofoK_QQxGc&feature=BFp&list=FLK4tSnlcI7PCF6f1uNEFiEA

MS

Thursday, September 1, 2011

First 100-Degree Day of the Summer???

3pm UPDATE
IT'S OFFICIAL! 100 degrees at the Louisville Int'l airport. First time this summer.
--------------------------
We're already at 98 degrees and it's only 2pm. With a dry ground and nearly cloudless sky, it looks almost certain that Louisville will finally break the 100-degree mark for the first time all summer. Meterologically, we start Autumn today; nevertheless, 100 degrees could be the high temperature today (or maybe higher).
Record for today is 103.

MS

Tornadoes on Easter Sunday

This is a worse case scenario. Tornadoes and flooded, blocked roadways making for great difficulties reaching residences affecting hard hit ...