Good Monday morning. Many people are spending time with families today. I will be working later, since this is still a busy time of year where I work.
Well, I have snow on the ground this morning. It only amounted to about 0.1". But, that is my first measurable snowfall of the season.
That got me thinking. How harsh and how snowy have the winters of this century compare to the winters of decades ago? I did some research and came up with some interesting statistics.
Let's start with the 2000's. Since 2000, here in Louisville, it has snowed every day of meteorological winter. That's right. At least a trace of snow has been reported for every date of December 1 through February 28 (29 for leap years).
The next statistic is maximum snow depth for any given day. During the 2000's, the most snow on the ground at any one time in Louisville was 10" on March 5, 2015. The next closest maximum was 8" on December 23, 2004.
What about the coldest temperatures during the 2000's here in Louisville? I counted 6 days when the temperature was below zero. The coldest reading was -6 degrees on February 20, 2015.
So, here is your summary:
Louisville (2000's):
Days of snow during Met Winter: all
Max snow depth: 10"
# of times below zero: 6
Coldest Reading: -6
Louisville (1980-1999):
Days of snow during Met Winter: all but February 19
Max snow depth: 18"
# of times below zero: 25
Coldest Reading: -22
Louisville (1960-1979):
Days of snow during Met Winter: all
Max snow depth: 18"
# of times below zero: 37
Coldest Reading: -20
Here is a summary of total snowfall for the same periods for Louisville:
2000's - 255.1"
1980-1999: 269.7"
1960-1979: 439.5"
(based on snow season (Jul-Jun) beginning 1959/1960)
Of course, the current time period will not end until December 2019. So, there is still quite a bit of winter left, but it is safe to say that the period of the 60's through the 90's have been much colder than the 2000's, at least here in Louisville. I have also shown that the period ending with the 70's was colder and snowier than even the 80's until present.
Could this be an example of climate change or Louisville's increasing heat island effect? I cannot verify that one. However, I can use another example. Let's try Lexington, who does not have as much of a heat island effect, though that seems debatable anymore.
Using the same criteria as above....
Lexington (2000's):
Days of snow through Met Winter: all
Max snow depth: 12"
# of times below zero: 14
Coldest Reading: -18
Lexington (1980-1999):
Days of snow through Met Winter: all but December 5
Max snow depth: 17"
# of times below zero: 35
Coldest Reading: -20
Lexington (1960-1979):
Days of snow through Met Winter: all
Max snow depth: 14"
# of times below zero: 61
Coldest Reading: -21
Summary of total snowfall for Lexington:
2000's - 256.5"
1980-1999: 275.9"
1960-1979: 423.5"
So, I still have to say that the 60's and 70's were a much colder and snowier period than today. Although the 80's and 90's were colder than today, snowfall amounts are about the same by the time you prorate the amounts.
In conclusion, we are living in warmer times, as characterized by the year end global reports. Yes, it's not just here. But, we are seeing much more volatile, extreme weather events as well. So, don't be fooled by a year of not much snowfall. It has happened in the past. Some years would see 3 or 4" only to be hammered by 20-30"+ amounts the next year. Expect to see more of that kind of weather and climate in the years to come.
Have a good week everyone. Snow chances are elevated. So, enjoy it.
MS
Monday, December 25, 2017
Monday, December 4, 2017
MikJournal Winter 2017/2018 Preview and December Outlook
Yes, I'm a little late to the party. I believe I have an excused absence after some 'extenuating' circumstances last week. But, trying to put last week in the rear view mirror, let's get to the winter preview and a look at what could happen this month.
Let me say I wish I had a trailer, you know, like one of those movie trailers that give you a preview of what's going to happen in the upcoming film. It would be an action-packed sequence of scenes interspersed with quiet, romantic moments, and ending with a cliff hanging, holding-your-breath departing shot, leaving you wondering, "What else could happen next?"
That's the kind of winter we could be looking at. Old Man Winter could be up for best actor in a leading role.
Meteorological winter began December 1. It will run through February 28. These are the months I am primarily addressing during this preview.
As a whole, expect a barrage of weather with nearly all facets on the table. I'm talking about snow, ice, flooding, severe weather. But, what about our region?
Wait a minute. You mean to say some of these things may not affect our region? Yes and no. Remember, historically, Kentucky has proven to be a battleground when it comes to winter weather. I do believe active weather will affect our region.
If we continue to see the Arctic region enjoying relatively calm conditions, high latitude blocking along the west coast and near Greenland, and an increasing subtropical jet thanks to La Nina, Kentucky will be a meeting place for all types of precipitation. While some may see a significant ice storm, others may see a snowstorm we haven't seen in a few years. As the winter progresses, the ups and downs will lead to Appalachian runners and Lake cutters, storm tracks that affect the type of weather we will have.
It's going to be interesting. So, buckle up.
DECEMBER OUTLOOK:
Well, the one thing that stands out is a persistent forecast for below normal temperatures for a good chunk of the first half of the month. In addition, disturbances within the flow may make for some wintry weather here as early as the 8th of this month. This would be followed by a brutal stretch of cold air that could put wind chills below zero for at least a couple of days. But, will the Greenland Block hold?
I have been seeing a consistent signal that says it will be weaker. Now, the ridge in the west looks to hold, so cold air will still have access to the U.S. However, the coldest of the air may slide more north of our area, or we may be brushed with the cold air then moderate shortly afterwards. Now, don't think I'm saying we will go from below zero wind chills to highs in the 50's within a few days. We are likely to see temperatures below average for at least the first half of the month.
So, what happens the second half of the month? It appears that the Arctic Oscillation will trend toward the neutral line, which means there should be a mix of storminess and calm in the Arctic region, keeping the coldest winds where they belong. That would help our temperatures to rebound some.
However, another shot of wintry weather looks to affect the region near or just after the middle of the month. Will that be snow for some and ice for some? It is possible. After another brief shot of cold air, I think the pattern relaxes just a little bit. We may even see temperatures near or even go above normal, what we would probably call a January Thaw, but in December.
Therefore, expect some nuisance snow showers periodically for the first part of the month along with a couple more significant systems. Dress warmly. Snowfall this month may exceed what some saw all of last winter. Hopefully, any icing will be short-lived.
I will try and post my January outlook by the end of this month.
MS
Monday, November 20, 2017
MikJournal Monday 11/20/2017...Another Stormy Weekend
Good Monday morning. Residents across parts of Kentucky are still reeling from storm damage as the result of a second bout of severe weather this month. As of this post, 2 confirmed tornadoes have now been assessed by the NWS during this latest installment of severe weather season part 2. Both tornadoes caused EF-1 damage. One was near Beaver Dam in Ohio County and the other was in Meade County near Guston.
Locally, at least in my neighborhood here in Valley Station, we fared somewhat better than the first bout of severe weather two weeks ago. Winds still were gusty all day long with peak gusts approaching 45 mph. But, no significant damage was found this time. Actually, damage from 2 weeks ago was not caused by severe thunderstorms but gradient winds with periodic gusts from 50-55 mph.
The intense line of thunderstorms raced eastward at speeds of at least 50 mph. Warnings were issued just west and southwest of my locations for potential wind gusts of 70 mph. As the line moved in, I was expecting a gusty rain shower. Instead, I got nearly the opposite. The skies momentarily brightened and winds actually abated. Yet, I can hear the roar of winds or heavy rain nearby similar to the distant sound of fast-moving traffic from an interstate. It was almost kind of eerie.
No snowflakes here. I really wasn't expecting any. But, the winds were quite brisk yesterday, easily negating any warmth from the sunshine. By the time I woke up this morning, I had a low temperature of 23 degrees and a thick frost. I even found some upper teens on the Kentucky Mesonet site.
Now, for the week ahead. Teleconnection signals still do not favor any type of wintry weather for the region. Yes, overall, we should still expect below normal temperatures, but not anything that unusual for the latter part of November.
The latest Euro run through next Monday keeps the coldest air to our north and northeast. However, shots of cold air are still going to affect the region, just not as cold as they could be.
The coldest air idea could be contingent on whether we establish any type of long-duration blocking near Greenland. So far, the GFS keeps waffling on this idea. A more negative NAO could help drive the coldest air more southward instead of north and northeastward. Nevertheless, we are still going to be affected by the cold air with mostly below normal readings.
For the period of November 25-December 03, temperatures are expected to range from near normal to below normal while precipitation is mostly below normal, according to the latest CPC outlook.
Longer range, the latest CPC outlook dated November 16 has the winter months of December through February coming in near normal to above normal while precipitation looks to be above normal for our region.
Last year on this date, we recorded a low of 27 degrees at Louisville International for its coldest reading for the month, that after a balmy 81 degree high on the 18th, just a couple of days earlier. Other locations in the state would see lows in the upper teens a couple of days later, like the 21st and the 22nd. So, really, it is not unusual to have cold mornings like this in November, not a big deal.
For you weather geeks out there who pay attention to October snow cover extent for forecasting the upcoming winter, there was another above normal reading for Eurasia...

In fact, this marked the 6th consecutive year of above normal anomalies.
The Northern Hemisphere SCE was the 9th largest out of the 50-yr record, nearly 21 percent above the 1981-2010 average. They too had a 6th consecutive above normal anomaly.
This should bode well for us snow lovers here in the United States. But, who and where will see the most snow this winter? There will be regions that see above normal snowfall this winter. Yet, we have to remember the drivers for this upcoming winter will ultimately determine the end result.
Remember last winter. We barely saw anything at all despite an above normal October Snow Cover Extent. Yet, some places were absolutely hammered, like the West and Northwest and parts of the Northeast. The have's and the have not's will be a feature of this upcoming winter as well.
That is all for now. Have a great week. Keep checking back as I continue gathering more data for the upcoming winter. I'm nearly ready to offer my brief winter outlook and in-depth December outlook soon.
MS
Locally, at least in my neighborhood here in Valley Station, we fared somewhat better than the first bout of severe weather two weeks ago. Winds still were gusty all day long with peak gusts approaching 45 mph. But, no significant damage was found this time. Actually, damage from 2 weeks ago was not caused by severe thunderstorms but gradient winds with periodic gusts from 50-55 mph.
The intense line of thunderstorms raced eastward at speeds of at least 50 mph. Warnings were issued just west and southwest of my locations for potential wind gusts of 70 mph. As the line moved in, I was expecting a gusty rain shower. Instead, I got nearly the opposite. The skies momentarily brightened and winds actually abated. Yet, I can hear the roar of winds or heavy rain nearby similar to the distant sound of fast-moving traffic from an interstate. It was almost kind of eerie.
No snowflakes here. I really wasn't expecting any. But, the winds were quite brisk yesterday, easily negating any warmth from the sunshine. By the time I woke up this morning, I had a low temperature of 23 degrees and a thick frost. I even found some upper teens on the Kentucky Mesonet site.
Now, for the week ahead. Teleconnection signals still do not favor any type of wintry weather for the region. Yes, overall, we should still expect below normal temperatures, but not anything that unusual for the latter part of November.
The latest Euro run through next Monday keeps the coldest air to our north and northeast. However, shots of cold air are still going to affect the region, just not as cold as they could be.
The coldest air idea could be contingent on whether we establish any type of long-duration blocking near Greenland. So far, the GFS keeps waffling on this idea. A more negative NAO could help drive the coldest air more southward instead of north and northeastward. Nevertheless, we are still going to be affected by the cold air with mostly below normal readings.
For the period of November 25-December 03, temperatures are expected to range from near normal to below normal while precipitation is mostly below normal, according to the latest CPC outlook.
Longer range, the latest CPC outlook dated November 16 has the winter months of December through February coming in near normal to above normal while precipitation looks to be above normal for our region.
Last year on this date, we recorded a low of 27 degrees at Louisville International for its coldest reading for the month, that after a balmy 81 degree high on the 18th, just a couple of days earlier. Other locations in the state would see lows in the upper teens a couple of days later, like the 21st and the 22nd. So, really, it is not unusual to have cold mornings like this in November, not a big deal.
For you weather geeks out there who pay attention to October snow cover extent for forecasting the upcoming winter, there was another above normal reading for Eurasia...
In fact, this marked the 6th consecutive year of above normal anomalies.
The Northern Hemisphere SCE was the 9th largest out of the 50-yr record, nearly 21 percent above the 1981-2010 average. They too had a 6th consecutive above normal anomaly.
This should bode well for us snow lovers here in the United States. But, who and where will see the most snow this winter? There will be regions that see above normal snowfall this winter. Yet, we have to remember the drivers for this upcoming winter will ultimately determine the end result.
Remember last winter. We barely saw anything at all despite an above normal October Snow Cover Extent. Yet, some places were absolutely hammered, like the West and Northwest and parts of the Northeast. The have's and the have not's will be a feature of this upcoming winter as well.
That is all for now. Have a great week. Keep checking back as I continue gathering more data for the upcoming winter. I'm nearly ready to offer my brief winter outlook and in-depth December outlook soon.
MS
Thursday, November 16, 2017
MikJournal Midweek 11/16/2017... A Lot of Data

Good afternoon. My expected midweek post was a little bit delayed. I had an influx of data to pore over and did not have time to write much of it out .
The map above is another winter weather prediction, this time from Dr. Judah Cohen, from AER (Atmospheric and Environmental Research). He has an interesting take on winter forecasting, using just a few main variables that occur during the Fall, and makes predictions how the atmosphere (both troposphere and stratosphere) will adjust to the known variables in play. Arctic sea ice levels and October Eurasian snow cover extent are just a couple of players he looks at in his forecast. You can find his winter weather forecast here.
In the meantime, I was looking over some data for the state of Kentucky during October. Did you know our state had its 9th wettest October during the last 123 years?
Lexington and Frankfort contributed to that statistic by recording top ten wettest Octobers.
Mesonet sites in Muhlenberg and Ohio counties recorded double-digit amounts at 12.16 and 10.01" respectively.
Teleconnections have been all over the place during the past few days. No clear and definable trend has led me to believe there is not much support for any winter storm for our region during the holiday period. Still, with projected normal to below normal readings, one cannot rule out some nearby snowflakes, but nothing that would impact travel at least here.
Although we cannot rule out isolated severe thunderstorms during the next storm system, no widespread severe weather is expected. But, gradient winds can do just as much damage, as was evidenced during last weekend's bout here in Louisville, where winds reached 50-55 mph.
Analogs do support a heavy rain threat, with 1" amounts likely. WPC suggests 0.50 - 1.00" for central and eastern Kentucky during the next few days.
Everyone who reads the journal regularly knows I like to make projections about monthly temperatures and/or precipitation.
Well, temperatures are about to go below normal for the month. How will we finish? We could be looking at a below normal November unless we have a few well-above normal temperature days. But, like I said earlier, through the holiday week, we are expecting near normal to below normal readings to persist.
More updates this weekend if necessary.
MS
Monday, November 13, 2017
MikJournal Monday 11/13/2017...Rollercoaster Weather
Good Monday to ya! A little dreary outside my place this morning with temperatures in the low 40's and a fairly high barometric pressure reading of 30.45". For you weather geeks like me, convert that to millibars (what you typically find on a weather map) by multiplying the inches of mercury by 33.8638815...and you have about 1031 millibars (mb), a fairly stout high pressure reading. By the way, the record highest pressure reading at Louisville is 30.98", or 1049 mb tied on February 12, 1981 and initially set on January 6, 1924. Okay, while I am on the subject, the lowest reading for Louisville is 28.93" (~980 mb) set also in the month of February on the 28th in the year 1902. And the only other time a barometric pressure reading dipped below 29" of mercury was February 10, 1960 at 28.98" (or 981 mb), good enough for a strong Category 1 hurricane. Thank you NWS Louisville for providing us with the numbers.
Typically, in the late Fall and Winter, high barometric pressure readings originate in the Arctic regions that slide southward and obviously carry much colder air. Again you weather geeks know that cold air sinks. In addition, as the air sinks, it warms (relatively) and expands, exerting a higher pressure at the surface and dries out the atmosphere just above the surface. So, often you have fair and cold weather associated with such areas of high pressure. For example, the February 12, 1981 temperature at Louisville (the day we recorded the highest pressure reading of 30.98") was 21 degrees for a high temperature and 0 degrees for an overnight low.
I provide this brief, amateur definition of high pressure because you will probably be exposed to pressure readings this week. The relatively high pressure today will be replaced by a monster low pressure system later this week. I have read and heard that the pressure readings associated with this low pressure may reach 990 millibars, or about 29.25" of mercury. That's a pretty strong storm system and will likely carry a lot of wind ( a result of difference between high and low pressure). The warmer air ahead of it will be pumped into our region via the Gulf of Mexico. Then, post-frontal winds will crank from the northwest and usher in much colder air, coming from the Arctic region. This setup provides a classic battle between warmth and cold and has potential to produce some high octane storms for our region later this week. Stay tuned.
As of today, we are still above normal in the temperature department. The Climate Prediction Center gave a fairly accurate outlook for our region through the 12th that temperatures would average out above normal for the first 12 days of the month. Well, how about the next 2 weeks?
The outlook for November 18-26 (most of this week not included) calls for a higher percentage of being below normal in the temperature department and near normal to below normal in the precipitation department for Kentucky.
A preliminary outlook for this week from the Weather Prediction Center through next Monday morning is for rainfall amounts to be in a range of 0.25" to about 1.00" statewide. Of course, these values are subject to change as upper air readings will be sampled throughout the week to determine how this volatile week will eventually unfold in our region.
No really significant extremes in temperatures yesterday. The highest reading was 89 degrees at Tucson AZ and lowest reading was 0 degrees at Bottineau ND.
One feature I like to look at is the temperatures in Alaska. The coldest temperature was -9 at Gulkana yesterday. That's not bad for them. Fairbanks has not recorded a below normal day yet this month. They are running over 12 degrees above normal so far. The outlook from the CPC has northern Alaska at above normal through the 26th while below normal for the central and southern parts of the state.
That should allow for chunks of cold air to reach our area. However, the air is still not truly 'Arctic' yet. Even Siberia is forecast to be above normal. That does not mean swimsuit weather. However, a weak polar vortex can still send down very cold air, at least according to our standards, even modified Arctic air.
I am currently working on a brief regional outlook for the winter as well as a December outlook. Please note I will not be posting seasonal snow totals again for this upcoming winter, since there is no sound basis for making such forecasts. However, I am posting a percentage factor similar to how the CPC provides in their outlooks for temperature and precipitation. Such outlooks will provide odds of above normal, near normal, and below normal categories.
A little preview for you. I do have a higher than average chance for ice (that is regular rain falling on ground at or below 32 degrees, not sleet) for the state. Also, a higher than average chance for above normal snowfall at localized areas of the state. Stay tuned.
Also, another little morsel. I like to follow teleconnection signals such as the Arctic Oscillation and Pacific North American. Well, I follow about 4 of these signals. They all have to be in agreement to support an increased chance for wintry weather. Admittedly, it may still be too early in the season to be incorporating such signals in a forecast. But, if this was late December/January, I would be getting really excited. Nearly all 4 signals are supporting a chance for wintry weather. There is one that is still oscillating, no pun intended. But, one of the signals is a bullish call for wintry weather later this month. Keep an eye on the trend. That's what I want to do.
I will be posting a mid-week report about the second half of the month in detail. Until then, signing off.
MS
Monday, November 6, 2017
MikJournal Monday 11/06/2017...Severe Weather Season Part 2
Welcome to my journal this Monday morning. This guy had a long night, so Monday morning came early in 2 ways. I was up after midnight already with winds still rather gusty but calming down from an hour earlier when wind speeds at my house exceeded 50 mph, knocking power out to nearby subdivisions. I didn't get to bed until nearly 2:00 a.m. due to working with a couple of my neighbors in clearing our road of my neighbor's large limb that measured at least 8" in diameter at the fork and at least 30 feet in length. Then, 6:00 a.m. is what time I normally would rise and shine. Uh, yeah, right. Too early. Went back to bed for another hour.
There were no severe thunderstorm warnings issued by the NWS Louisville. At first, I could not understand why. I had only been asleep for about 30 minutes when I heard the winds roaring outside my window. I stepped out on the back porch and was impressed by the winds. However, there was no rain and no lightning. Yet, we were experiencing winds in excess of 50 mph along with regular gusts of 40-50 mph for up to 20-30 minutes. Quite a long time for even a severe thunderstorm.
Radar showed a band of storms just to my southwest and another band just north and northwest of my area. The NWS would call these high gusts of winds 'gradient winds'. Too much science this early in the day to try and explain. Yawn. Anyway, I had thought that perhaps a decaying line of nearby storms contributed to a rush of winds reaching the surface. But, even that would not typically last 30 minutes.
Here is a brief look at highest winds recorded around the state..
.png)
This event has proven to be the most damage my area has seen this year. And technically, it was not a storm. Any rain that would fall was well after I finally fell asleep and only amounted to a meager 0.03". Add that to the 0.01" between 10 and 11 p.m. last night and I have a drenching total of 0.04". Forecast for my area was about 0.75" to 1.00". However, there was a thin west to east line several miles long but only a few miles thick that registered similar amounts or recorded no rainfall at all. What a weird night.
Most of our region escaped severe thunderstorms. There were a couple of wind reports in western Kentucky. In southern Indiana, NWS survey teams are going to check out Washington and Orange counties to determine any tornadic signatures and damage. The bulk of the severe weather stayed mostly along and north of Indianapolis to Cleveland to parts of Pennsylvania.
Temperatures yesterday were very warm. Dewpoints in the 60's added a little more stickiness to the air, except the winds helped to alleviate that quite a bit. Louisville reached a high of 78. I saw a Mesonet site showing 80 degrees down state.
It appears that the next several days should feature below normal readings to help offset the blistering start to the month...ok, maybe not blistering, but still well above average.
However, I do not see any snowflakes in the near future. Teleconnections show a trough west ridge east type setup or at the very least a zonal component for the next week or so, which should bar any significant cold air intrusions that would have any staying power. So, low temperatures in the 20's and 30's is not unusual for November, just a shock to the senses after the nice weather we've had over the last few days.
As for extreme weather, I leave you with the findings of what caused the failure of Kelley Barnes Dam at Toccoa Falls, Georgia on November 6, 1977...
Dam Failure
National Weather Extremes...
November 06...
2006 - Nehalem, OR...11.77" (state 24-hr precipitation record)
November 11-12...
1980 - Key West Int'l Airport, FL...23.28" (official state 24-hr precipitation record)
Have a good week. Hopefully, a little more tranquil.
MS
There were no severe thunderstorm warnings issued by the NWS Louisville. At first, I could not understand why. I had only been asleep for about 30 minutes when I heard the winds roaring outside my window. I stepped out on the back porch and was impressed by the winds. However, there was no rain and no lightning. Yet, we were experiencing winds in excess of 50 mph along with regular gusts of 40-50 mph for up to 20-30 minutes. Quite a long time for even a severe thunderstorm.
Radar showed a band of storms just to my southwest and another band just north and northwest of my area. The NWS would call these high gusts of winds 'gradient winds'. Too much science this early in the day to try and explain. Yawn. Anyway, I had thought that perhaps a decaying line of nearby storms contributed to a rush of winds reaching the surface. But, even that would not typically last 30 minutes.
Here is a brief look at highest winds recorded around the state..
This event has proven to be the most damage my area has seen this year. And technically, it was not a storm. Any rain that would fall was well after I finally fell asleep and only amounted to a meager 0.03". Add that to the 0.01" between 10 and 11 p.m. last night and I have a drenching total of 0.04". Forecast for my area was about 0.75" to 1.00". However, there was a thin west to east line several miles long but only a few miles thick that registered similar amounts or recorded no rainfall at all. What a weird night.
Most of our region escaped severe thunderstorms. There were a couple of wind reports in western Kentucky. In southern Indiana, NWS survey teams are going to check out Washington and Orange counties to determine any tornadic signatures and damage. The bulk of the severe weather stayed mostly along and north of Indianapolis to Cleveland to parts of Pennsylvania.
Temperatures yesterday were very warm. Dewpoints in the 60's added a little more stickiness to the air, except the winds helped to alleviate that quite a bit. Louisville reached a high of 78. I saw a Mesonet site showing 80 degrees down state.
It appears that the next several days should feature below normal readings to help offset the blistering start to the month...ok, maybe not blistering, but still well above average.
However, I do not see any snowflakes in the near future. Teleconnections show a trough west ridge east type setup or at the very least a zonal component for the next week or so, which should bar any significant cold air intrusions that would have any staying power. So, low temperatures in the 20's and 30's is not unusual for November, just a shock to the senses after the nice weather we've had over the last few days.
As for extreme weather, I leave you with the findings of what caused the failure of Kelley Barnes Dam at Toccoa Falls, Georgia on November 6, 1977...
Dam Failure
National Weather Extremes...
November 06...
2006 - Nehalem, OR...11.77" (state 24-hr precipitation record)
November 11-12...
1980 - Key West Int'l Airport, FL...23.28" (official state 24-hr precipitation record)
Have a good week. Hopefully, a little more tranquil.
MS
Wednesday, November 1, 2017
MikJournal Midweek 11/01/2017...Welcome To November
Thanks for dropping by. Usually, I do not write a midweek post, but this is the beginning of another month. Let's try and see how the month of November could affect our region.
Louisville's average temperature:
November 1 high - 65
November 1 low - 44
November 30 high - 51
November 30 low - 34
Highest November temperature: 85 degrees (set last year on November 1 and 2)
Lowest November temperature: -1 degrees in 1950 on November 25
Average total snowfall by November 30 - 0.2"
Highest snowfall total by November 30 (starting from July 1 beginning of snow year) - 13.2" (1966)
Sunrise/Sunset times
November 1 - 8:09am/6:43pm...10 hrs 34 min.
November 30 - 7:40am/5:23pm...9 hrs 43 min.
This is just data I like to provide to help you understand how much shorter are the daylight hours compared to last month. And the colder weather that often accompanies these shorter days.
Here is another interesting statistic: cloud cover
During the past couple of years, the months of January and February, which often contributes to a cold feeling day, have been the cloudiest here in Louisville. However, if we get a few days of solid cloud cover as a result of some inversion, which can happen this time of year, cold air can become trapped and take longer to burn off since the sun angle is so much lower.
Also, I have now included a couple more seasonal items on the side of the blog:
AER (atmospheric and environmental research) discusses the Arctic Oscillation, a significant player in the winter months.
Teleconnections shows a forecast at the 500mb level for other potential drivers/players of the winter season such as the EPO, NAO, PNA.
For the first part of November, I am still looking at a milder and wetter pattern compared to normal for our region at least through the 12th. Afterward, we might see another pattern change that may introduce colder air intrusions.
Weak La Nina is still expected for the upcoming winter season. However, weather patterns are different than last year about this time when a weak La Nina was about to commence. It's all about timing of weather systems and what drives them.
If we have many troughs that get cut off from the jet stream, weather systems will not be as progressive. However, last winter, our region was in a peak, or high point, while the west and northeast were in a valley, or low point.
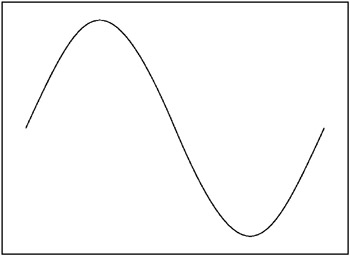
This winter, the progression of weather systems should put us in an upward slope. Depending on the amount of cold air and strength of weather systems, the sine wave could be compressed with lots of valleys and peaks resulting in numerous chances for precipitation in our region. Often, with compressed sine waves, we have stronger storm systems that typically 'warm us up' just before frontal passage and backside snows with the post-frontal passage.
What I am trying to say here is if you are a snow lover, stay tuned. An upward slope is what you want. If we can get just a normal system in here a few times this winter, I think many of us will be happy. The downside is that a stronger storm system follows a path that keeps the heaviest wintry precipitation to our west and north. That has happened here in our region several times over the years.
But, I'll focus more on that in a future post. Just whetting your appetite.
MS
Louisville's average temperature:
November 1 high - 65
November 1 low - 44
November 30 high - 51
November 30 low - 34
Highest November temperature: 85 degrees (set last year on November 1 and 2)
Lowest November temperature: -1 degrees in 1950 on November 25
Average total snowfall by November 30 - 0.2"
Highest snowfall total by November 30 (starting from July 1 beginning of snow year) - 13.2" (1966)
Sunrise/Sunset times
November 1 - 8:09am/6:43pm...10 hrs 34 min.
November 30 - 7:40am/5:23pm...9 hrs 43 min.
This is just data I like to provide to help you understand how much shorter are the daylight hours compared to last month. And the colder weather that often accompanies these shorter days.
Here is another interesting statistic: cloud cover
During the past couple of years, the months of January and February, which often contributes to a cold feeling day, have been the cloudiest here in Louisville. However, if we get a few days of solid cloud cover as a result of some inversion, which can happen this time of year, cold air can become trapped and take longer to burn off since the sun angle is so much lower.
Also, I have now included a couple more seasonal items on the side of the blog:
AER (atmospheric and environmental research) discusses the Arctic Oscillation, a significant player in the winter months.
Teleconnections shows a forecast at the 500mb level for other potential drivers/players of the winter season such as the EPO, NAO, PNA.
For the first part of November, I am still looking at a milder and wetter pattern compared to normal for our region at least through the 12th. Afterward, we might see another pattern change that may introduce colder air intrusions.
Weak La Nina is still expected for the upcoming winter season. However, weather patterns are different than last year about this time when a weak La Nina was about to commence. It's all about timing of weather systems and what drives them.
If we have many troughs that get cut off from the jet stream, weather systems will not be as progressive. However, last winter, our region was in a peak, or high point, while the west and northeast were in a valley, or low point.
This winter, the progression of weather systems should put us in an upward slope. Depending on the amount of cold air and strength of weather systems, the sine wave could be compressed with lots of valleys and peaks resulting in numerous chances for precipitation in our region. Often, with compressed sine waves, we have stronger storm systems that typically 'warm us up' just before frontal passage and backside snows with the post-frontal passage.
What I am trying to say here is if you are a snow lover, stay tuned. An upward slope is what you want. If we can get just a normal system in here a few times this winter, I think many of us will be happy. The downside is that a stronger storm system follows a path that keeps the heaviest wintry precipitation to our west and north. That has happened here in our region several times over the years.
But, I'll focus more on that in a future post. Just whetting your appetite.
MS
Monday, October 30, 2017
MikJournal Monday 10/30/2017...Transitions
Good Monday morning. I saw my first flakes of the season yesterday. Not much, just a few dotting my windshield. It was mixed with an occasional 'Styrofoam dot', softly bouncing off of the windshield. Nevertheless, it was cold.
Lexington recorded a high of 39 degrees for the date yesterday, just 4 degrees off of the record coldest high temperature for the day. One year ago from yesterday's date, they had set a record warm high of 82. Louisville reached 41 degrees yesterday. A year earlier, they too recorded a record warm high of 84 degrees. What a difference a year makes!
We have certainly entered a transitional period during the past week. Just a few days ago, Louisville was looking at one of its warmest Octobers on record, perhaps exceeding last year's warmest October. However, the recent cold spell of well below normal temperatures has now pushed the averages out of any 'top ten warmest' consideration for October.
Now, looking ahead to November, it appears the first part of November, at least through the 12th, may be milder and wetter than normal across our region. Perhaps a zonal flow will help shut off any cold air intrusions from our northern neighbors for a while.
Be looking for an update on one of this winter's drivers, the Arctic Oscillation. Dr. Judah Cohen, from the AER, (find this on the side of the blog) should be updating his thoughts this week.
Mount Washington in New Hampshire, at the weather observatory some 6280 feet in elevation, recorded a 124 mph wind gust yesterday. It has been a wet month with over 11" of precipitation. Surprisingly, only 2.7" of snow and ice have been recorded so far. Their average temperature is running some 10 degrees above normal.
Forks, WA is one of my favorite precipitation places to follow. Last year's more than 143" was the wettest calendar year since 1999, when nearly 161" was recorded that year.
Hilo, HI is another fun one to follow. Their all-time maximum precipitation record dates back to 1990 when some 211" was recorded. This year, though, has been much drier than average. However, a wetter than normal 'wet season' is forecast. So, the 57" or so that has fallen is likely to exceed 100" for the year, perhaps well below the average of nearly 127" though.
No national extremes for this week. But, still plenty of wild weather along the east coast and northeast.
Have a good week everyone.
MS
Monday, October 23, 2017
MikJournal Monday 10/23/2017...Stats and Siberian Snowfall
Good morning and welcome to another installment of my weekly journal. What am I putting into the journal today? Well, I think some might be getting excited about winter. So, I'll touch on that for a moment.
While it is exciting to hear about possible flakes of snow before next weekend, wind chills resembling December readings, and the first pot of chili for those of us who waited until now, it is still just the second half of meteorological Fall. Even I hate to say this, but we will see the 60's and 70's again this season.
I took a look at the European 10-day model for potential temperatures, and this is what I found.
After today, I found some 50's for highs in my part of north-central Kentucky before surging into the low 70's or so ahead of a stronger blast of cold air set to arrive by Friday.
So far, the coldest air looks to stay north of the region. Therefore, I cannot say for certainty that snow flakes will materialize with any precipitation that falls behind the front. Still, it will be cold air, and windy too, which will feel even colder.
In addition, it looks like a prolonged cold pattern. Depending on cloud cover, initially, temps may struggle into the 40's for high temperatures. Afterward, even with clear skies, we could be looking at highs in the upper 40's to upper 50's for high temperatures and 20's and 30's for low temperatures. This is a far outcry from the coolest October day of 62 degrees last year. Now, I say prolonged because it should last longer than 3 days in a row. So, we have more below normal temps than above normal temps at least for a little while as we close out the month and enter November.
October has been another toasty month overall, similar to last October. But, this cold spell should negate any chance for another record warm October like 2016. Coming into today, Louisville would easily beat out the 2016 record. But, the averages will be coming down over the next several days. Without making any projections, I still believe it is safe to say that October 2016, at least for Louisville, will be a top ten warmest on record contender.
The Global report is in. For a change, it's not a record setter. But, it looks to be in the top 3 by the end of the year.
The September report shows the global combined land and ocean temperatures as the 4th warmest on record for the month. The Northern Hemisphere had its 3rd warmest.
For the January through September period, the global combined land and ocean temperatures were the 2nd warmest on record, right behind 2016. The Northern Hemisphere recorded its 2nd warmest, again behind 2016.
Nationally, the preliminary tornado counts were down last month. However, we are still on track to record the 3rd most tornadoes since 2005.
Back to the snow. Usually, some look to Siberian snow cover in October to understand what effects we may experience here in our part of the U.S. But, doesn't it depend on what will be the main driver for this year's weather? The Siberian snow cover in October is just one driver. Don't forget about El Nino/La Nina, blocking highs, sea ice levels, jet streams. Yes, there are a lot of drivers that affect the atmosphere.
Siberian snow cover was very impressive in October of last year. Yet, our part of the world here in Kentucky saw near record low levels of snowfall for the winter. There was also a weak La Nina in place. So, something besides the Siberian snow cover proved to be the main driver of last year's winter, at least here.
Some did get the snow. The mountains of California saw an abundance of snowfall, the likes of which they have not seen in years, which proved very helpful in replenishing reservoirs for the upcoming summer of 2017 and overcoming devastating drought. Many stations in Maine reported over 100" last winter, well above their average.
So, although the Siberian snowfall in October is off to another good start this year, other drivers such as the potential for another weak La Nina, will compete for driving this year's winter weather.
I will be studying the data during the month of November and offer a brief seasonal outlook of what we could expect here regionally. Then, I will be focusing on a monthly outlook and update any adjustments if needed throughout the winter months. No, I won't be offering any snow accumulations for the entire winter, as that is not scientifically sound. But, levels of above, near, or below normal will be offered.
In conclusion, no national weather extremes to offer for the week, but on this day in 1920, Theodore Fujita was born. And in 1947, it was estimated that thousands of fish fell from the sky in Marksville, LA covering an area of about 1000 feet long by 80 feet wide.
Here's hoping no fish lands on your head today. Make it a great week and get those chili pots ready. I know I will.
MS
Monday, October 16, 2017
MikJournal Monday 10/16/2017...Mid Month Report and Looking Ahead
Ahh. What a breath of fresh air. Good Monday morning to you. Today is starting out much cooler and drier than we've been in a while. I'm registering 50 degrees here at my house at 6:30 this morning, but the dry air makes it feel much cooler. Also, patchy cloud cover is probably keeping my temperature from falling into the 40's. But, several locations are already well into the 40's that surround the city of Louisville.
In addition, I do think some areas could see patchy or even a light frost by tomorrow morning in our region. At just after 6:30 this morning, the lowest temperatures I could find include a 38 degree reading in Harlan county, but that is at 4000 feet, and a 42 degree reading at Mayfield in western Kentucky. Good morning Cynthiana. You were at 43. With another hour before sunrise, temperatures could fall a little bit more where clearing has taken place.
Well, this morning I have prepared a mid-month report about our temperatures for parts of our region.
First, I want to take you back to October 2016. That month was very warm. It was the 7th warmest on record for Lexington, 5th warmest at Frankfort, and 3rd warmest for Bowling Green.
In fact, at Louisville, it was the warmest October on record. Typically, we think of October as a transition month from very warm to very cool. So far, this October and last October have not fit that description.
Using the base or average temperature of 65 degrees, last October through the 15th had already registered just 6 days below the average of 65 for a total of 18 degrees. Normally, we should see 74 total degrees below that average for the first 15 days. Guess how many days have been registered this month below that 65 degree average...just 1 day for a total of 2 degrees. Not much transition so far.
Now last year, it actually was warmer during the second half of October than the first. Again, where's the transition? Not here.
Ok, you might need to hold your head in place with both hands for this one. The second half of October last year was just as warm, even a tad warmer, than the first 15 days of this month. And this month is well along to being a top ten warmest October contender, perhaps a top 3.
However, a transition is still possible for the second half of this month. It looks like we may not see this blistering pace continue much longer. I still believe we will see more days above normal than below normal. But, the colder shots are going to be more noticeable, cutting into those lofty averages.
I am trying to put more faith in the GFS signal that colder air, below normal type of air, will infiltrate our region before month's end. But, the Euro continues to paint normal to above normal temperatures through the rest of this week and slightly beyond. By this time next Monday, the Euro should have a reasonable guesstimate as to the depth of any cold air that could invade our region by the end of the month. But make no mistake about it. Cold air is building in Canada. And it's just a matter of time before chunks of that air mass slide this way.
In conclusion, Ophelia in the east Atlantic looks to hit Ireland with hurricane gusts today. Extreme weather on display.
Here is a look at past extreme weather for the dates of October 16-22....
October 20...
2004 - Mt. Charleston F.S., NV 7.78" (state 24-hr precip record)
October 20-21...
1996 - Portland Jetport, ME 13.32" (state 24-hr precip record)
1996 - Mount Washington, NH 11.07" (state 24-hr precip record)
Make it a good week
MS
Monday, October 2, 2017
MikJournal Monday 10/02/2017...Welcome To October!
Good Monday morning. October, one of my favorite months of the year has arrived. And, we have pretty nice weather days ahead. Louisville's average high and low temperatures start out at 75/54 and ends the month with an average high/low of 65/45. Daylight hours continue to dwindle, starting out the month at 7:39 am sunrise and 7:25 pm sunset (11 hours and 46 minutes) on the 1st and ends the month at 8:08 am sunrise and 6:44 pm sunset (10 hours and 36 minutes), a loss for the month of 1 hour and 10 minutes. Don't worry. Daylight savings time does not end until the first weekend in November. The last day will be Saturday, November 4th. Then, turn your clocks back that night for the hour of sleep you lost during the Spring. Already feeling better, aren't you?
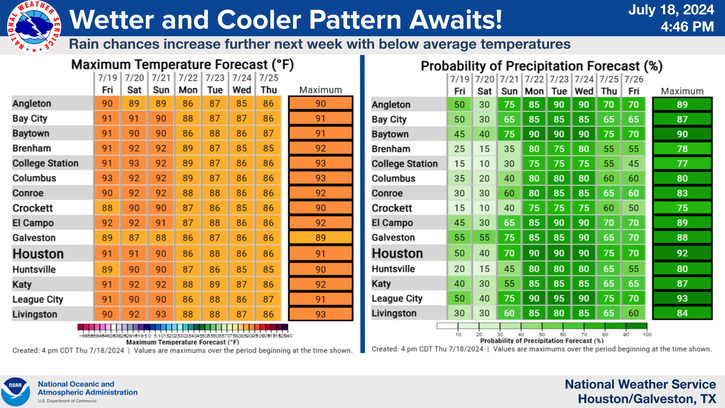
I have been following this story for well over a month now. But, it looks like Houston may make another run at its all-time precipitation record as early as this week. I am glad to see the NWS Houston/Galveston put out a graphic showing the wettest years ever at its official site (which has changed locations throughout the years).
After recording only 1.23" for the month of September (a welcome reprieve indeed), rain chances are on the increase through midweek, and this includes the Houston area. So far, it appears the heaviest rainfall should materialize along the coastal areas. By the way, the official location at IAH (Bush Intercontinental Airport Houston) is located about 20 miles north of the downtown area. Lesser rain amounts? We'll see.
Not much worry here for heavy rainfall, at least according to the Climate Prediction Center. As of September 30, they issued their final October outlook and say that the month should be warmer than average and drier than average for Kentucky.
Perhaps with several clear nights ahead, take advantage of the often crisp air, making for excellent stargazing conditions. In fact, a series of meteor showers will be on display over the next few months. Here is a calendar of the more popular ones for viewing....
October 7-8...Draconids
October 21...Orionids
November 4-5...South Taurids (bright moon may impact viewing)
November 11-12...North Taurids
November 17-18...Leonids
December 13-14...Geminids
I have personally enjoyed the Orionids, Leonids, and the Geminids in years past.
Recently, I reviewed some statistics for the past month and found something I never really took notice of before, average wind speed at select locations here in Kentucky.
Here are a couple of examples. Paintsville and Jackson in eastern Kentucky barely averaged about 1 mph last month. I thought this was a fluke; therefore, I checked other months during the year. Generally, average wind speeds stayed below 6 mph, even during the windier months of January, March, and April.
Even in Harlan County, at a Kentucky Mesoset site with an elevation of 4,031 feet, the average wind speed last month was around 5.4 mph.
Louisville actually recorded an average wind speed of 10.3 mph for the month of March 2017. That was probably a little too windy for kite flying. Of course, there is not any mountainous terrain to help cut down on the flow of wind such as in the eastern part of the state.
Finally, no doubt our hearts continue to go out to our friends in Puerto Rico, as the aftermath of Hurricane Maria continues to unfold. Communications and transportation infrastructure or lack thereof has really hampered efforts to get the needed supplies to where they need to go.
Of course, Puerto Rico is no stranger to tropical systems. Perhaps some residents will remember a tropical storm called Isabel in 1985 that affected the island during early October. In fact, on the 7th, a 24-hour precipitation record of 23.75" was observed near the Tora Negro Forest. Much of Puerto Rico was affected by Isabel, and the resulting flash floods and mud slides contributed to the deaths of some 180 persons.
I will be paying attention to the tropics during the upcoming week. I have a camping trip to Myrtle Beach planned later this weekend. And it's not looking good....
Enjoy your week. I'll catch up to you later.
MS
Friday, September 29, 2017
Midweek Post 09/28/2017...September Projection
What a comeback! After nearly 2 weeks of Fall-like temperatures earlier this month, the longest stretch of 90 degree heat ends today in Louisville. Eight consecutive days in the 90's beat out the previous streak of 7 in July. In addition, the entire state's average temperatures increased. What was once expected to be an impressive below normal month now shows several reporting stations (at least NWS offices) going to be near normal or even above normal.
Here is a look at the NWS offices in Kentucky and their temperature departure from average as of this morning, the 28th...
Louisville..........+0.3
Lexington..........+0.1
Bowling Green...-0.5
Frankfort............+0.6
Jackson...............-0.2
London...............-1.2
Paducah.............+1.7
However, we have transitioned again to our Fall-like pattern, but maybe only for a few days. Yet, it may be enough to help offset these averages just a bit for the rest of this month.
So, what did I come up?
Projection time....
My information is taken from the F-6 form at weather.gov, a preliminary form of the monthly climatic data. If you look just below the last calendar day entry, on the left hand side, you will note a sum (SM) with a couple sets of 4 digit numbers like this...
SM 2216 1646
This represents the sum of the high temperatures from the one column and the sum of the low temperatures from the next column.
I total these together.
Next, find the average temperature for the month then multiply by 30 days and multiply again by 2 for another total sum.
Now, compare the total sum for 'average' with the current total sum in the sample above.
Subtract the current sum from the monthly 'average' sum.
Look at the area forecast for the rest of the month and add the forecast high and low temperatures through midnight of the last day of the month.
How does this compare with the 'average'? Is it higher? Lower?
Sounds complicated, but not really.
Let me walk you through Louisville's F-6 sheet...
SM 2211 1669......Current Sum = 3880
Average temperature for September is 71.0 degrees (found on another page)
Multiply 71.0 by 30 days = 2130
Multiply by 2 (for combining high and low)
Average September Total Sum = 4260
Subtract Current Sum from 'Average' Sum = 380
Expected Forecast temperatures total...
low temp from this morning = est. 60
high temp 28th = 75
low temp 29th = 53
high temp 29th = 76
low temp 30th = 51
high temp 30th = 71
Add those numbers to get 386
This number is greater than the 380 just to reach normal
Therefore, the forecast or projection is for a total of 3880+386=4266
Divide 4266/30 days to get combined high/low 142.2
Divide by 2 to get overall average of 71.1
71.1 is greater than the 'average' for September of 71.0
Therefore, projection is Louisville to finish the month 0.1 degrees above normal
Lexington should finish at normal or 0.1 degrees above normal depending on how they round the numbers.
Jackson looks to finish right at normal, even slightly above but not enough for rounding up.
Frankfort and Paducah should finish above normal.
Bowling Green and London should finish the month below normal
There you go. Only 2 out of the 7 forecast centers that I follow are projected to be below normal. Oh, by the way, the Louisville Bowman Field area, the WFO, the one with less concrete than the official site, may actually finish at least 0.3 degrees above normal, kind of surprising compared to the official site.
MS
Monday, September 25, 2017
MikJournal Monday 09/25/2017...Review of Summer
I hope your Monday is off to a good start. Before I get into some of the details of this summer past, how about this stretch of summer? Here in Louisville, we have recorded 5 consecutive days in the 90's. That has now raised our September average temperature to a modest 1.3 degrees below normal. Lexington is only 1.2 degrees below normal. And we still have at least 3 more days of above normal readings to go before we begin transitioning to more seasonal levels.
Dare I say I might be making projections for the temperatures of September? This should have been a slam dunk for below normal temperatures this month, after the 2 weeks of 'ahhh' weather we enjoyed earlier this month. But now...?
It's going to be that close. Quite likely, I will be making a midweek post with projections about whether we will be below, at, or above normal for the month.
Just a preliminary look, and again, this is not my official projection yet, but this could be how it plays out for the rest of the month...
Remember, all of this could change, because there is a cold core of air that will be positioned just to our west, but it seems that the NWS Louisville is not taking this into consideration yet.
Looking at a normal month in Louisville of 71.0 degrees for the entire month of September, we would need a total (high and low combined) of 4,260 degrees. Right now, we have achieved a total of 3,404 degrees, leaving us with a total combined high and low temperature of 856 degrees to go for the rest of the month just to achieve normalcy.
The official forecast for Standiford Field is for a total of 858 degrees, which by definition would make it an above normal month. However, once all of the averages are taken into consideration and subsequent rounding, it may just become a normal month.
Following the same pattern but for Lexington, I achieved a similar result, an above normal month by definition, but after averaging and rounding, just a normal month.
So, that will be interesting to see how it unfolds.
Now, a review of this past summer. Regionally, I already kind of hashed the numbers out in an earlier post. But, most of the region saw a below normal summer for June-August. Nationally, how did we do?
While Kentucky was accompanied by several states of the mid and deep south for a below normal summer, Nevada and California saw their warmest summer on record. Oregon almost achieved their warmest summer.
Montana had its 2nd driest summer on record and is in the grips of an impressive drought. Mississippi had its wettest summer ever, while Florida and Louisiana had their 2nd wettest summer on record.
In fact, Naples in Florida has already seen its wettest year on record, and that is with incomplete data from earlier this month.
Globally, could the string of year after year warmest land and sea temperatures be coming to an end? It's possible. Projections (not mine this time) are for 2017 to be the 3rd warmest on record when combining the land and ocean surface temperatures.
So, keep an eye for that midweek post. Hopefully, I'll have updated information whether there will be a more pronounced cooling trend coming up or not.
Otherwise, make it a good week.
MS
Monday, September 18, 2017
MikJournal Monday 09/18/2017...Remembering Hurricane Hugo and Maria Looming
Welcome to another installment of MikJournal Monday. It looks like a pretty quiet week in terms of weather. Yes, there will be a few showers out there from time to time, not a complete washout. Temperatures are going to be warm, very warm as the averages try to come up from several days of below average readings this month.
In fact, 13 of the first 14 days of the month saw below normal temperatures here in Louisville. However, it appears we will have several days this week of temperatures near or above normal, depending on cloud coverage. Then later this week, possibly later in the weekend, we will begin transitioning to more fall-like temperatures.
So, with our weather nice and warm, I wanted to talk hurricanes for this segment. On this day in 1989, Puerto Rico was ravaged by Hurricane Hugo as landfall occurred near the town of Fajardo on the main island. The San Juan airport registered wind gusts of over 90 mph and the old Roosevelt Roads Naval Station had a 120 mph gust.
Of course later on, Hugo would make its trek through the Bahamas and set its sights along the Southeast coast, eventually making a significant, impactful landfall near Charleston, SC at Sullivan's Island as a Cat 4 hurricane.
As a side note, the Hurricane Hunters had what was called the 'Hairy Hop' as the initial plane, nicknamed 'Kermit', went to fly into the eyewall at about 1,500 feet, and got a little more than they were expecting. Normally, they would fly at an altitude of 5,000 to 10,000 feet but were anticipating a weak hurricane.
Well, the hairy hop occurred when they encountered severe turbulence that put the mission, and for that matter, the lives of the 16 aboard, in jeopardy. Ironically, prior to takeoff, one of the reporters had asked, "Where are the parachutes?", the response was that parachutes would be of no value where they were going.
Severe turbulence? You be the judge. An updraft/downdraft/updraft triplet of 20 mph, 22 mph, and 45 mph respectively and horizontal winds of 185 mph violently shook the plane, causing even secured items to become loose in the cabin such as a 200-pound life raft, and caused a fire in one of the four engines. Worthy of a Hollywood blockbuster film, the pilots have to take measures to erase a 620 foot plunge of a few seconds that keeps them some 880 feet above the ocean waters. Crippled, the plane still has to be navigated to find a way out...
More information, including a story from the lead flight commander, can be obtained from sites below...
the hairy hop
Hunting Hugo...as told by Dr. Jeff Masters
I like a good cliff-hanger, or in this case, a hurricane hanger.
I mention Hugo, because another hurricane is about to hit the island of Puerto Rico. Meet Maria. If that happens, where will it go afterward? Could it take a similar trek as Hugo and head for the east coast?
A fairly reliable forecast model has the trek staying out to sea once it emerges from near the Bahamas. In fact, it may even stay a bit more east of Jose's track. But, remember, Irma's direction could not be accurately predicted until just hours before landfall. The models just could not figure out the periphery of the sub-tropical ridge.
The strength or weakness of that ridge will play a huge role in where Maria will go, and determine how close any impacts will be realized along the east coast. At the very least, waves and rip currents will continue to be a problem for the rest of the week and into the weekend.
Make it a great week.
MS
Thursday, September 14, 2017
MikJournal Midweek Post 09/14/2017...Rainfall Amounts and Geography Trivia
As promised, I am posting a midweek update for rainfall totals and some geography trivia that might ruffle some feathers. So, please provide any other suggestions I can use to help answer the trivia question. More on that in a moment.
In Jefferson County, I have seen rainfall amounts range from 0.38" to 1.10" since September 11, or this past Monday. Here at my house, I saw 0.56", bringing my monthly rainfall total to 5.22". The airport at Louisville International has also recorded 0.56" through noon today.
However, since the state continues to see showers today, I will not be updating the totals on the side of the blog until the weekend.
Next up is Jose. The Euro has Jose weakening but tracking farther westward than some residents' comfort level allows. Although no landfall is forecast for the U.S., the center may approach close enough to throw some wind and rain toward Cape Cod, Martha's Vineyard, and Nantucket Island. However, wave action will be quite noticeable. Rip currents are expected to be a problem. It will be a storm system that the Northeast residents will want to watch pending any additional westward shift.
Now, for your geography trivia, which might prove controversial...
A two-part trivia question for you. Based on the map, what is the westernmost point of the Eastern Time Zone in Kentucky? What is the easternmost point of the Central Time Zone?
I invite your input. I have looked at my Kentucky map and found Meade County to be the westernmost point of the Eastern Time Zone and Russell County as the easternmost point of the Central Time Zone.
But, this is where it could become quite controversial. Now, when I ask where, hopefully you understand I am not looking for a physical location, like a boat dock ramp or a highway mile marker or even a county line sign. I am not even asking for someone's property like Old Man Williams' scarecrow in the back of his cornfield (name is fictitious, if name is Williams, sorry about that). I am talking about a community or town which has a legitimate, verifiable post office and zip code.
I came up with Concordia in western Meade County though there are a couple of others that could be acceptable. Then, I came up with Vinnie near the Russell/Pulaski county line.
I find time zones and daylight/standard time interesting. Did you know our Eastern Daylight Time is the same as Atlantic Standard Time? A few northeastern states have been mulling over whether to switch to Atlantic Standard Time instead of fooling with the switch twice a year. I guess some people don't like to lose that extra hour of sleep during the initial Spring switch or show up one hour late to Church during the initial Fall switch.
We'll talk again...
MS
Monday, September 11, 2017
MikJournal Monday 09/11/2017...Irma's Fury and Regional Impact
Good Monday to ya! Clouds are beginning to stream into our region from Irma, now blasting southern Georgia after pummeling the state of Florida.
The hurricane may not have been as intense as expected, but its widespread effects were felt statewide across Florida, and its effects will be felt throughout most of Georgia into Alabama and Tennessee.
And yes, we will feel the effects here, but it should not be as bad as Harvey's remnants. A general 1-1.50"(WPC) could be realized throughout the week along with some gusty winds and cool temperatures, at least through midweek.
Irma's fury was realized across Florida yesterday. Some notable highlights were a 142 mph wind gust at Naples, an apparent vortex or spin-up in the background as Mike Bettis of The Weather Channel was reporting live footage about the hurricane, the millions of residents who have no power statewide, and now that daylight has arrived, the damage left behind.
We are still awaiting word on how our relatives and friends have fared during this frightful ordeal.
Some of the local storm reports coming out of central Florida this morning were water rescues in West Orange county, hurricane wind gusts of 75-80 mph at Orlando, significant flooding along Beach Rd in Daytona, additional wind gusts of 65-70 mph just north of Orlando in Leesburg and Sanford.
I have been following live coverage on WESH 2 about the severe flooding in Orlo Vista.
Also, the relentless rainfall was noted in this climatological report for Sunday...
Daytona Beach: 4.10 inches; Daily record
Fort Pierce: 13.08 inches; Daily and ALL TIME record (since 1901)
Melbourne: 10.23 in; Daily and ALL TIME record (since 1937)
Orlando: 6.61 in; Daily record
Sanford: 9.24 in; Daily and ALL TIME record (since 1948)
Across South Florida, several of the weather offices have missing data for yesterday, such as precipitation amounts and highest wind speeds. Hopefully, all of the data will eventually be made available soon. But, video footage shows much tree damage and other property damage.
I am checking in on live coverage on NBC 6 out of Miami, listening to the damage assessments coming in, watching drone footage of the damage in Naples, wind and flooding. Even saw a video of Kristen Bell, voice of Princess Anna in the movie 'Frozen', paying a surprise visit to a shelter at a middle school, helping comfort the little ones there.
Even before Irma's visit, Naples recorded its wettest summer of all time, records dating back to 1942, with 41.42". That would compare to a little over 20" maximum amounts here in Kentucky.
Speaking of Kentucky, heavy rainfall from the 2nd tropical system this month is poised to move into the region, possibly soaking areas that received over a half foot of rain earlier this month. However, it has been emphasized that the rainfall from Irma does not appear it will match the amounts we saw from Harvey.
I will have a midweek post that will include any rainfall amounts locally and any wind gusts associated with the remnants of Irma. Also, you know that Kentucky has two time zones in the state, central and eastern. But do you know the westernmost point of the eastern time zone in the state? How about the easternmost point of the central time zone? Check back with suggested answers in your geography trivia for the week.
Have a good one.
MS
Monday, September 4, 2017
MikJournal Monday 09/04/2017...Summer Recap and Harvey_Irma
Welcome to the first Monday of Meteorological Autumn. Yep, it's hard to believe, but summer is officially over...well, after today according to some pundits.
Summer really fizzled out there at the end. Oh yeah, we had some hot summer days here at my place and in the 'heat island capital of the country' at Louisville International airport. But, August went down in the books as a below normal month for temperatures, first time having a below normal month since May 2016 according to the NWS Louisville.
In addition, most of the region had a below normal summer. Bowling Green, Lexington, Frankfort, and even Louisville, well, most of Louisville, ahem...sorry, I had to clear my throat. Although the NWS Louisville modestly calculated the official summer as normal (or 0 degrees average), my calculations say they barely eked out an above normal summer...
June...+0.3
July...+1.4
Aug...-1.5
Boys and girls, that leaves us with a balance of +0.2. Now, divide that by the 3 months of summer and we get an average of +0.0666. Now, when I was in school, I was taught to round up if the number was a 5 or higher. Well, that 0 in the tenths place needs to be rounded up because the 6 in the hundredths place says so, according to the rules. Therefore, that gives us a total average of +0.1 degrees.
I rant about this, because it is what it is, another concrete-aided, above normal summer. Yet, you travel right down the road at Bowman Field, another airport with a lot less 'crete and more grass, and you have a below normal summer, rather decisively I might add. Personally, I believe the NWS office is trying to downplay the obvious or glaring difference that everyone else was below normal while officially Louisville was above normal. I've said it before, the official location is a poor representation from a climatological standpoint and needs to change.
Moving on finally. Regional rainfall totals are in from the leftovers of Harvey, and they are impressive. Nearly 9" fell during the 3-day period from August 31 through September 2 at the Mesonet site in Barren County not far from Glasgow. Why, even at my house 10 miles southwest of Louisville International airport, I collected 4.46".
Speaking of rainfall measurements, I have been collecting rainfall for both of my rain gauges. I have a 5" Acurite manual rain gauge and a homemade rain gauge that is comprised of a Barilla spaghetti jar and a funnel the exact size of the opening diameter. I have been complaining about the Acurite rain gauge being inaccurate for some time now. But, an interesting thing happened....
Well, both of the gauges were nearing full capacity, unchartered territory for both gauges. In fact, my homemade rain gauge's funnel had rainwater standing halfway up the funnel. I think I still had room for another half inch before overflow. So, I collected 4.46" in that gauge. Then, I measured the Acurite gauge, expecting overflow. Surprisingly, it was under 4.50". In fact, it registered a little bit less than my homemade rain gauge, at 4.40".
After this evidence, I am becoming more convinced that the Acurite rain gauge really can measure 5" of rainfall; however, the demarcation lines leading up to the 5" mark are not as accurate as they should be. At times, I believe that some measurements may be more than 0.25" off.
Now, looking ahead. I have looked at the latest GFS and Euro runs for Hurricane Irma. There is still uncertainty about where this beast is heading. At 7-8 days out, the Euro has Irma nearing the southern coast of Florida turning northerly parallel to the coast and making landfall in the Carolinas.
The GFS has a more southerly track with landfall in Florida and moving northward through Georgia.
I don't much stock into the GFS. But, it does warrant attention, since it has Irma paying a visit to Kentucky and parking it here with more insane tropical rainfall amounts for our region.
The Euro has Irma affecting parts of our region, though the low pressure center looks to stay east of the Appalachians. Still, it appears moisture will be driven westward, affecting primarily central and eastern parts of the state.
Again, it is a long ways out. But, I'm sure we will be glued to our Tv's, anticipating the next run from the models, perhaps even making Vegas-style wagers about where and if this thing will make landfall.
Just stay tuned. We are at least a week away from any effects that may impact the region.
Meanwhile, here is your state and territory weather extremes for the week....
September 4...
1979 - Annas Hope, Virgin Islands (U.S.)...20" (24-hr Precip Record)
September 4-5...
1970 - Workman Creek, AZ...11.4" (24-hr state precip. record)
September 6...
1925 - Centreville, AL...112 degrees (state high temp record)
Make it a great day and rest of the week.
MS
Wednesday, August 30, 2017
Midweek Update...A Harvey Welcome
It's not every day a celebrity makes it to our neck of the woods. But, Harvey is about to make an appearance to our great state albeit uninvited. Any one planning on rolling out the red carpet? I didn't think so.
After pummeling the Houston/Galveston regions with unprecedented rainfall totals over a 4-5 day period, Harvey is on the move after making yet another landfall. So far, the models have handled Harvey's trek fairly well. I have been impressed. The rainfall forecasts, although quite bullish earlier in the week, still underachieved in some places with its 30-40" totals. A handful of locations saw 40-50", even a little over 50" in at least one location of the Houston area.
I was hoping that the remnants of Harvey would get moving pretty quickly by the time it reaches our region. I am still hopeful. But, precipitation forecasts are going up for the region.
I had to wait till today to separate out any rainfall totals that were expected for the first part of the week and not combine them with the remnants of Harvey's totals coming up for the first part of our holiday weekend.
Now, I am starting to see a clearer picture, although the numbers are still aggressive. However, I downloaded a 3-day precipitation amounts map from one of the top analogs for this kind of weather setup and found an interesting parallel...
This is from September 20-22, 1979:

Low pressure formed just north of another 'H' tropical system that languished in the Gulf, picked up the remnants of Henri, and squeezed out a bunch of moisture over our region, to the tune of 3-6" nearly statewide.
Here in Louisville, our 3-day total was 5.41", Lexington at 5.27". Amounts of 4-6" were quite common in central and eastern KY, with a least 2 deaths attributed to the event.
I would not be surprised if we see similar totals related to this upcoming event. However, keep in mind, the most rainfall should be realized just to the north and northwest of the low pressure center (of Harvey). Just like earlier this summer, isolated tornadoes can spin up with these former tropical entities in addition to the heavy rainfall.
In conclusion, 3-6" looks possible for many areas, especially along the storm's track and again just to the north/northwest. Otherwise, 2-4" looks like a good bet for the rest of us.
MS
Monday, August 28, 2017
MikJournal Monday 08/28/2017...History-Making Hurricane Harvey
Good Monday to you. Unfortunately, it's not a good Monday for residents of the Houston/Galveston regions. Personally, I have family who live in the Houston area, so I am concerned for their safety, especially for my pregnant cousin.
Hurricane Harvey will go down in the record books as one of the costliest natural disasters on U.S. soil, perhaps one of the wettest Cat-4 hurricanes to strike the United States, and quite likely the name will be retired.
Interestingly, if you notice my Did You Know segment on the side of the blog, the same names of tropical systems are used every 6 years, unless they are deadly or costly then the name is retired from the list to avoid any sensitivities of those who were most affected.
That's why our 2017 list, when compared to the 2005 list, does not include Katrina, instead it is Katia. We have Don this year, not Dennis. Whitney is used on the list for 2017, not Wilma.
Yes, there was a Harvey on the list in 2005. But, it was a rather unimpressive tropical storm, primarily affecting the Bermuda region with wind gusts to 50 mph and about 5" rain.
Then, in 2011, Harvey attained only tropical storm status again, but this time a bit more vigorous. Satellite data suggested a peak intensity of about 60-65 mph at landfall near Dangriga, Belize. Affecting mainly Mexican interests and high terrain, the system rained itself out over the mountains, producing widespread flooding and mudslides.
Back to the present, Hurricane Harvey has produced a tremendous amount of rain for areas of southeast Texas. With little movement, bands of heavy rain continue to inundate the region. Forecasts out now are for storm totals to reach or exceed 50" in places. Hopefully, it won't be that bad, as radar data seems to indicate the heaviest of the bands have moved out of that area for now.
I have collected a few numbers and statistics out of the Houston area this morning...
Not only did Houston establish a single-day rainfall record for yesterday with 16.07" officially at the IAH airport, but it was the wettest day for any given day of the year on record.
Additionally, this is now the wettest August of all time and the wettest month ever, beating out June 2001, with Tropical Storm Allison's flooding rains. And there is still time to add to the monthly total of 32.68"
Since June 1, 46.16" has been recorded. This is most impressive as one considers that Houston's annual rainfall is 49.77".
Over the next few days, the remnants of Harvey will move up into our region. As of this writing, forecast amounts of 1-2" with local amounts exceeding 2" are expected. This should cause some rises in area creeks and streams, but overall flooding does not look to be a widespread issue. Nevertheless, stay tuned to your favored local media sites for the latest updates.
Turn around, don't drown. Be safe everyone.
MS
Monday, August 21, 2017
MikJournal Monday 08/21/2017...Eclipse Day and Eclipse History
Happy Eclipse day, which just happens to be a Monday. Today, I just want to take a brief look at the number of total solar eclipses to affect the United States over the last 100 years or so. Okay, maybe not the eclipses themselves, but what was the weather like that particular day. Perhaps any weather records set that day? Any other events? Let's take a look.
Not counting the total solar eclipse today, I counted 10 other ones that affected the United States over the past century.
1918
June 8...Louisville records a high of 79 degrees and a low of 53, nearly 8 degrees below normal.
Nova Aquila, brightest nova since Kepler's nova of 1604, was discovered.
1923
September 10...Lexington's high and low was 74 and 55, nearly 6 degrees below normal. They were also in the midst of an impressive 11-day cool snap from September 7-18, peaking on the 14th when the high was only 61 and the low was a relatively cold 41 degrees.
1925
January 24...Louisville enjoyed a pleasant 52 degrees after a cold start of 24. The temperature would surge briefly to 59 degrees the next day then keep falling the next couple of days, bottoming out at -2 with nearly 6" snow on the ground.
Moving picture of the solar eclipse taken from dirigible over Long Island
1930
April 28...Lexington high of 77 and low of 59 with 0.02" rain for the day.
1st night organized baseball game played at Independence Kansas
Carolyn Jones was born...think Morticia on Addams Family
1932
August 31...Hottest day of the month for Louisville and Lexington at 96 degrees.
Earlier in the month, on the 2nd, Lexington would record 8.04" for its rainiest day on record for any given month.
1945
July 9...Louisville typical hot day at 90 and low of 66 with rain moving in later along cold front, producing pleasant weather for the next few days
1954
June 30...Temperature reaches 97 in Louisville. No eclipse going to stop this impressive heat wave when temperatures hit at least 90 degrees for 27 out of 28 days.
Yankee pitcher Tom Morgan hits 3 batters in one inning tying a record
1963
July 20...A high of 88 in Louisville; the day before hit 91 degrees for the only 90-degree day of the month. It was a rainy month, settling in at #10 of all July's on record
Mary Mills wins U.S. Women's Open Golf Championship
Not necessarily on this day, but by July 1 the United States Postal Service introduced ZIP (Zoning Improvement Plan) codes to help facilitate a more efficient method of mail delivery.
1970
March 7...Typical cool early March day with 58 degrees in Louisville
You knew an eclipse signified gloom and doom...about a month later the Beatles disband
1979
February 26...38 degrees in Louisville, part of a very cold month (8th coldest February right behind 2015)
About a week earlier on the 18th, the Sahara Desert received a rare snow event for 30 minutes
You can buy a Sony Walkman for 200 dollars...ouch.
Make it a great day. Remember, don't look up at the Sun without protection. Take advantage of this historic, astronomical, scientific day.
MS
Monday, August 14, 2017
MikJournal Monday 08/14/2017...Summer Wakes Up and Your Latest Geographical Trivia
A good Monday to you. I awoke to a few light showers this morning at the old homestead. As I write this, the shower activity is moving off to my east and weakening some. I have recorded a few hundredths of an inch. So far, it's enough to preclude any grass cutting chores until maybe the afternoon if we get enough sunshine.
Well, how about those below normal temperatures? So far, the CPC has been spot on with its probability forecasts for below normal readings here. In fact, check out this month's temperatures at the nation's heat island capital here in Louisville...
As you can see, Louisville has recorded only 1 day above normal so far. Yep, you have to go back to August 1 for Louisville to have an above normal kind of day. That's amazing!
As a side note, take a look at Fairbanks, AK temperatures for this month...
As you can see, Fairbanks has recorded only 1 day below normal, around the 2nd of the month. I often refer to the Alaska - Kentucky connection. When we're down, they're up and when we're up, they're down, generally speaking, not always. But, still, I thought this was an interesting relationship to show this morning.
So, back to my main thought, several locations in central Kentucky are averaging between 3 and 4 degrees below normal for the month. Additionally, all of the locations that I look at here in Kentucky are recording below normal readings. It's been a wonderful trend. But, is it about to end?
Here is a picture I saved from the CPC for the period of August 19-23...

So, it looks like summer is finally waking up again.
Here is a look at this month's geographical bit of trivia. I perused the longitude line and found Cozumel at 86.92 degrees west, a popular destination for those who love 'cruising'. In fact, one of its beaches has been ranked in the top ten beaches of Mexico for 2 years in a row, Paradise Beach.
So, I followed the 86.92 degree line of longitude into Kentucky and found a place called Paradise (at 86.98 degrees, close enough). Located in Muhlenburg County, it was an old mining town that served its purpose. But, once the coal deposits were depleted and any iron ore was fully mined during the mid and late 1800's, Paradise would become a forgotten place on the map. Raining down on residents was cinder fallout from some tallstacks about a mile away and eventually led to many residents selling their places to the TVA in the late 1950's and 60's. Quite a contrast to what we would normally expect from a name like Paradise. Finally, Postmaster Buchanan dispatched his last bag of mail and the office closed in November 1967. Thank you for the information at http://www.kykinfolk.com/muhlenberg/history/paradise2.htm
Finally, here's a look at this week's state records and weather extremes....
August 18-19
1955...Westfield MA...18.15" (state 24-hr Precip Record)
August 19
1955...Burlington CT...12.77" (state 24-hr Precip Record)
2007...Hokah MN...15.10" (state 24-hr Precip Record)
August 19-20
1939...Tuckerton NJ...14.81" (state 24-hr Precip Record)
August 20
1983...Greenville GA...112 degrees (ties Max State Record)
Have a good week, everyone.
MS
Well, how about those below normal temperatures? So far, the CPC has been spot on with its probability forecasts for below normal readings here. In fact, check out this month's temperatures at the nation's heat island capital here in Louisville...
| DY | MAX | MIN | AVG | DEP |
| == | ==== | ==== | ==== | ==== |
| 1 | 90 | 71 | 81 | 2 |
| 2 | 86 | 70 | 78 | -1 |
| 3 | 90 | 67 | 79 | 0 |
| 4 | 82 | 63 | 73 | -6 |
| 5 | 82 | 58 | 70 | -9 |
| 6 | 75 | 65 | 70 | -9 |
| 7 | 80 | 66 | 73 | -6 |
| 8 | 85 | 65 | 75 | -4 |
| 9 | 85 | 63 | 74 | -5 |
| 10 | 89 | 67 | 78 | -1 |
| 11 | 88 | 68 | 78 | -1 |
| 12 | 87 | 71 | 79 | 0 |
| 13 | 87 | 63 | 75 | -4 |
As you can see, Louisville has recorded only 1 day above normal so far. Yep, you have to go back to August 1 for Louisville to have an above normal kind of day. That's amazing!
As a side note, take a look at Fairbanks, AK temperatures for this month...
| DY | MAX | MIN | AVG | DEP |
| == | ==== | ==== | ==== | ==== |
| 1 | 71 | 56 | 64 | 4 |
| 2 | 59 | 55 | 57 | -3 |
| 3 | 71 | 55 | 63 | 3 |
| 4 | 70 | 56 | 63 | 4 |
| 5 | 79 | 53 | 66 | 7 |
| 6 | 83 | 55 | 69 | 10 |
| 7 | 81 | 58 | 70 | 11 |
| 8 | 76 | 57 | 67 | 9 |
| 9 | 82 | 52 | 67 | 9 |
| 10 | 74 | 55 | 65 | 7 |
| 11 | 69 | 53 | 61 | 3 |
| 12 | 71 | 54 | 63 | 6 |
As you can see, Fairbanks has recorded only 1 day below normal, around the 2nd of the month. I often refer to the Alaska - Kentucky connection. When we're down, they're up and when we're up, they're down, generally speaking, not always. But, still, I thought this was an interesting relationship to show this morning.
So, back to my main thought, several locations in central Kentucky are averaging between 3 and 4 degrees below normal for the month. Additionally, all of the locations that I look at here in Kentucky are recording below normal readings. It's been a wonderful trend. But, is it about to end?
Here is a picture I saved from the CPC for the period of August 19-23...

Take a look at Kentucky's overall probability for above normal temperatures during this time period. In fact, I looked at the Euro model, and their forecast is for normal to above normal temperatures for our region during this same time period.
Just for fun, look at Alaska's expected temperature pattern. Below normal. Hmmm.So, it looks like summer is finally waking up again.
Here is a look at this month's geographical bit of trivia. I perused the longitude line and found Cozumel at 86.92 degrees west, a popular destination for those who love 'cruising'. In fact, one of its beaches has been ranked in the top ten beaches of Mexico for 2 years in a row, Paradise Beach.
So, I followed the 86.92 degree line of longitude into Kentucky and found a place called Paradise (at 86.98 degrees, close enough). Located in Muhlenburg County, it was an old mining town that served its purpose. But, once the coal deposits were depleted and any iron ore was fully mined during the mid and late 1800's, Paradise would become a forgotten place on the map. Raining down on residents was cinder fallout from some tallstacks about a mile away and eventually led to many residents selling their places to the TVA in the late 1950's and 60's. Quite a contrast to what we would normally expect from a name like Paradise. Finally, Postmaster Buchanan dispatched his last bag of mail and the office closed in November 1967. Thank you for the information at http://www.kykinfolk.com/muhlenberg/history/paradise2.htm
Finally, here's a look at this week's state records and weather extremes....
August 18-19
1955...Westfield MA...18.15" (state 24-hr Precip Record)
August 19
1955...Burlington CT...12.77" (state 24-hr Precip Record)
2007...Hokah MN...15.10" (state 24-hr Precip Record)
August 19-20
1939...Tuckerton NJ...14.81" (state 24-hr Precip Record)
August 20
1983...Greenville GA...112 degrees (ties Max State Record)
Have a good week, everyone.
MS
Subscribe to:
Posts (Atom)
-
Recently, I noticed that our days have now begun to shorten. However, our sunset here in Louisville still remains at 9:10pm edt. Starting th...
-
 In July of this year, I did a segment about the latest sunsets in the eastern time zone. This corresponded nicely with the summer solstice a...
 -
A 1 Temperature C Humidity F Heat Index 2 81 82 86.82 This is an Excel spreadsheet program. Fairly ...
