Another Monday. It's not too bad facing today after a beautiful weekend. Hope you had a chance to enjoy it.
Let's talk about ridges and troughs, shall we?
A ridge is often associated with sinking air. As the air sinks, it warms. So, think warmer. Now, a trough is just the opposite, associated with cyclonic flow and a 'cold' low pressure, often a signal of below normal temperatures, or at least relatively cooler conditions.
A fascinating thing happens here in the U.S. When there is a ridge that develops in the western part of the U.S., a hot spell can result. I saw on Sunday, Excessive Heat Watch and Heat Advisory products were issued for coastal Washington state down to central California.
Why, even Barrow AK saw its warmest temperature since July 30, 2009. It reached 68 degrees on the 29th the other day.
On the flip side, while the west is baking, the eastern part of the U.S. is shaking, okay, maybe not that extreme. But, temperatures have turned cooler for many of us.
Houlton, ME recorded a temperature of 38 degrees early last weekend. Mount Washington, NH saw a low of 34 (of course, they are located over 6,200 feet in elevation).
The forecast for next weekend is for more below normal temperatures. The European model has backed off just a tad on how cool it will be for us in our region by next weekend. But, still, at the very least, we will see similar temperatures like what we enjoyed this past weekend and maybe slightly cooler.
The Climate Prediction Center is forecasting a medium to high probability for below normal temperatures extending nearly into the middle of August. Huh? That would be something we haven't seen around these parts in quite a while.
Precipitation comes in mixed for the state. Several areas along and east of I-75 saw excessive rain amounts for the month. Near Maysville, over 10" has been recorded at a Kentucky Mesonet site, most of that occurring since July 21.
However, I can say that some areas came in with very little rainfall, because just southwest of Louisville International airport where I live, I only received 1.71" for the month. I find it absolutely amazing that Maysville has received nearly twice the amount of rain in one month than I have received in two months.
Finally, as I conclude this post, I just received an update that Tropical Storm Emily has formed off the coast of Tampa FL. But, it seems the National Hurricane Center is confident this won't be a repeat of Charley from 2004, going from nearly nothing to a major hurricane in 24 hours.
Have a good week everyone.
MS
Monday, July 31, 2017
Sunday, July 23, 2017
MikJournal Monday 07/24/2017...Geography...Streak Ends
Good morning to one and all. You'll never guess what happened at my house over the weekend. It rained, hard enough to measure in a rain gauge. My emoji is all smiles, jumping up and down in puddles with a raincoat on.
Yes, it's true. Although the weather radar was lit up with yellow and red returns, at one time I was barely getting enough rain to wet the pavement while my nearby neighbors in adjacent communities were soaking in nearly an inch of rainfall. But, by the end of the day, I had recorded 0.60" and my rain barrel was full again.
My garden is happy, except for one of my chili pepper plants blew over, thanks in part to 35-40 mph winds and at least 6-7 maturing Anaheim chili peppers, the longest one being about 7" long, weighing on the entire plant. That problem has been fixed. No serious damage, just lost a little twig with no fruit flowering on it anyway.
It ends a 'no measurable rainfall' streak of 15 consecutive days at my house, driest it has been since Louisville International recorded only 0.03" during a 20-day stretch from August 21 - September 9, 2016.
Bad news is I'll be out there today cutting at least the front yard. But, it looks like the worst of the heat is behind us, you know, that 100-105 degree heat index stuff. Enjoy the reprieve because I'm sure the dog days of August will eventually bring us more heat.
Speaking of heat, July 28 is coming soon, marking the hottest day in Kentucky's history that occurred in 1930 at Greensburg with a sweltering 114 degrees.
Also, today, Louisville will be commemorating it's hottest day ever at 112 degrees set in 1952, good enough for a share of the state all-time record. Huh? Oh, did I not mention it was for the state of Georgia? That's right. Louisville, GA and later Greenville (on August 20 1983).
Other all-time state high temperatures observed today include Alton, KS at 121 degrees in 1936; Minden, NE at 118 degrees in 1936; and Wahluke, WA at 118 degrees in 1928.
Well, I'm a huge geography buff. I wish people would appreciate the subject a little bit more. We can learn a lot about our little part on this globe. Mountain ranges, highest points, lowest points, longest rivers, widest rivers, tallest waterfalls, largest states, smallest states, and so much more.
Today, I looked at latitude coordinates. For every point on a map, there is a latitude and longitude coordinate. So, I found another latitude coordinate that is nearly identical to ours here in Louisville, way out in California. It's called San Andreas, a relatively small town. Perhaps you have heard of it.
Ah, but do not be deceived that this is where the San Andreas Fault System owes its name. A little bit of history reveals that a professor named Andrew Lawson discovered a part of this fault system in 1895 and named it after the nearby lake, Lagunas de San Andreas, or San Andreas lake, just south of San Francisco, since it was in the valley that the fault resides.
Therefore, San Andreas does not lie on the San Andreas fault line. In fact, the town is nearly 100 miles northeast of San Francisco.
Have a good week everyone. Stay safe. That means 'Don't text and drive' and 'Go indoors when thunder roars' and 'Turn around, don't drown'.
MS
Thursday, July 20, 2017
Midweek Post...Evaporation Project
Since my local climate is working on a 13th consecutive day of no measurable rainfall, I decided on Tuesday, the 18th, to arbitrarily fill my rain gauge with stored rainwater from the barrel. This was an ideal time to perform a detailed evaporation project. Hot temperatures, plenty of sunshine, no rainfall, varying dewpoints.
My goal is to demonstrate that the period of time during the day that produces the most evaporation is the middle of the day through the afternoon, a time that I will often see residents and businesses 'wasting' water, bringing little benefit to the soil and wasting precious natural resources, incurring, I hope for them, a hefty water bill for the billing cycle.
I started my project at noon on the 18th with 3.33" rainfall in the gauge.
By 11:00 a.m. this morning, nearly 47 hours later, the gauge registered 2.68", a loss of 0.65" in just those 47 hours.
My hypothesis was that the period of observation between 12:00 p.m. and 5:00 p.m. would yield a higher percentage of the total evaporation within an undetermined time period (I have to make sure it's not going to rain...that's why it's not a determined period of time).
Although my results are not final, preliminary readings show that of the 0.65" that evaporated from the gauge during the 47-hour period, 0.37" occurred during the 2 - five hour periods listed above for the 18th and the 19th.
This represents 57 percent of the total evaporation occurred in just this 10-hour period of time. Nearly 0.04" per hour on average evaporated during this peak time of noon to 5 for both days.
On the other hand, the other 37 hours produced an average evaporation rate of only 0.008" per hour. When we compare the two evaporation rates (0.04"/hr versus 0.008"/hr), do the math yourself. The rate during peak evaporation was 5x greater than the other hours.
Therefore, my preliminary conclusion is watering the lawn is not beneficial to the root system during the middle of the day as much is evaporated. In addition, disease generation is promoted. I'm not the only one suggesting this, but 'professionals' will tell you that watering the lawn early in the morning is more beneficial as the ground can soak up the water more efficiently with a less likely introduction of disease that can actually harm the lawn.
-----------------------------
Briefly, switching gears, I looked at the U.S. Drought Monitor report due this morning....
Kentucky still does not show any drought, or even abnormal dryness (which I was expecting for a couple of counties in northwest Kentucky).
MS
Monday, July 17, 2017
MikJournal Monday 07/17/2017...Drying Out and Hotter
Here's to hoping your Monday is off to a good start. Well, I noticed some mid level cumulus clouds this morning streaming in from the northwest. Along with falling pressure, this is normally a good indicator of possible showers later today in the region. However, it's coming in from the northwest, a less favorable condition for moisture support. In addition, pressure has stabilized and even risen during the past hour and clouds are thinning across my area.
NWS Louisville has stated a slight chance of rain for my area, so we'll just have to see. I could really use the rain, since I have recorded a little over an inch for the month so far.
Here's a look at the Kentucky drought status...thru July 11

That's right. Absolutely no drought or abnormal dryness.
However, I am becoming more confident that some areas along the Ohio River of north-central and northwestern Kentucky may be experiencing some abnormal dryness in the next report due out this Thursday.
With an expected heat wave building in this week, the ground is really going to dry out for many of us. Here in the Louisville area, not much rain has fallen this month. And really, no rain is expected for much of the week after today.
In fact, at my house in Valley Station, just southwest of Louisville's official reporting site at the airport, I have not recorded any measurable rainfall since July 7. Therefore, if no rain falls today, I could be looking at 2 consecutive weeks of no rainfall by this Friday. Thank goodness for my rain barrel that still holds over 50 gallons. I really only need about 6-7 gallons a week for the garden when there is no rainfall. But, I may need a little extra for the established plants I own such as my hostas, azaleas, liriopes, and knockout roses. I'll just have to monitor those closely.
Some of you may not be experiencing much drying of the ground yet. But, I'm sure I will be seeing residents locally trying to water their lawn during the middle of the day. I cannot tell you how much that annoys me. Watering the lawn for 3 to 4 hours during the middle of the day is less beneficial for your yard and an absolute waste of natural resources than if you just spend an hour in the early morning. Less watering, more benefit. But, some people...some people you just cannot convince. "I'll do what I want, you can't tell me what to do. It's my yard, my water bill, just back off." (sigh)
Along with a drier ground, temperatures are really going to respond. Last summer, Louisville's highest temperature was 96, Lexington at 95, Frankfort at 95, and Bowling Green at 96. I think Louisville stands a really good chance of matching or exceeding last year's high this week. Stay tuned.
I am showing you these locations in Maine because the Climate Prediction Center is anticipating below normal readings for much of the last week of July. In fact Houlton recorded a low of 42 within the past few days.
Many of these areas experienced a heavier than normal snowfall this past winter. Most locations reported over 100". I found a range of 78 - 147".
Here is Caribou's report.... (chart might be hard to read)
Remember, the snow year officially runs from July 1 through June 30. Caribou's normal snowfall is 108.7". Therefore, the above normal snowfall is representative of the kind of winter our friends in Maine experienced overall.
Here was the report from Hartford, a city just southwest of Augusta the capital and generally north of Portland....
In fact, there was a 62" snow depth that set a record dating back to 1998, when this station first started recording data.
Certainly, this made our winter look even more dismal in comparison.
Oh, well. Something to cool you off with nonetheless.
Have a good week...
MS
NWS Louisville has stated a slight chance of rain for my area, so we'll just have to see. I could really use the rain, since I have recorded a little over an inch for the month so far.
Here's a look at the Kentucky drought status...thru July 11
That's right. Absolutely no drought or abnormal dryness.
However, I am becoming more confident that some areas along the Ohio River of north-central and northwestern Kentucky may be experiencing some abnormal dryness in the next report due out this Thursday.
With an expected heat wave building in this week, the ground is really going to dry out for many of us. Here in the Louisville area, not much rain has fallen this month. And really, no rain is expected for much of the week after today.
In fact, at my house in Valley Station, just southwest of Louisville's official reporting site at the airport, I have not recorded any measurable rainfall since July 7. Therefore, if no rain falls today, I could be looking at 2 consecutive weeks of no rainfall by this Friday. Thank goodness for my rain barrel that still holds over 50 gallons. I really only need about 6-7 gallons a week for the garden when there is no rainfall. But, I may need a little extra for the established plants I own such as my hostas, azaleas, liriopes, and knockout roses. I'll just have to monitor those closely.
Some of you may not be experiencing much drying of the ground yet. But, I'm sure I will be seeing residents locally trying to water their lawn during the middle of the day. I cannot tell you how much that annoys me. Watering the lawn for 3 to 4 hours during the middle of the day is less beneficial for your yard and an absolute waste of natural resources than if you just spend an hour in the early morning. Less watering, more benefit. But, some people...some people you just cannot convince. "I'll do what I want, you can't tell me what to do. It's my yard, my water bill, just back off." (sigh)
Along with a drier ground, temperatures are really going to respond. Last summer, Louisville's highest temperature was 96, Lexington at 95, Frankfort at 95, and Bowling Green at 96. I think Louisville stands a really good chance of matching or exceeding last year's high this week. Stay tuned.
| 82 | 58 | ME | PORTLAND/INTL JETPORT |
| 80 | 56 | ME | GREENVILLE_(AMOS) |
| 79 | 59 | ME | CARIBOU/MUNI |
| 80 | 55 | ME | PRESQUE_ISLE_(AWOS) |
| 80 | 56 | ME | CLAYTON_LAKE |
| 85 | 59 | ME | AUGUSTA/STATE |
| 85 | 59 | ME | BANGOR/INTL |
| 78 | 55 | ME | BAR_HARBOR_(AWOS) |
| 78 | 55 | ME | FRENCHVILLE |
| 85 | 58 | ME | HOULTON/INTL |
| 83 | 58 | ME | WISCASSET |
| 86 | 55 | ME | FRYEBURG |
| 84 | 57 | ME | AUBURN-LEWISTON |
| 85 | 60 | ME | MILLINOCKET/MUNI |
| 77 | 59 | ME | ROCKLAND/KNOX(AWOS) |
| 86 | 53 | ME | SANFORD_MUNI_(AWOS) |
| 84 | 60 | ME | WATERVILLE_(AWOS) |
I am showing you these locations in Maine because the Climate Prediction Center is anticipating below normal readings for much of the last week of July. In fact Houlton recorded a low of 42 within the past few days.
Many of these areas experienced a heavier than normal snowfall this past winter. Most locations reported over 100". I found a range of 78 - 147".
Here is Caribou's report.... (chart might be hard to read)
Year
|
Jul
|
Aug
|
Sep
|
Oct
|
Nov
|
Dec
|
Jan
|
Feb
|
Mar
|
Apr
|
May
|
Jun
|
Season
|
|---|---|---|---|---|---|---|---|---|---|---|---|---|---|
| 2016-2017 | 0.0 | 0.0 | 0.0 | T | 20.2 | 41.2 | 19.4 | 15.8 | 23.6 | 9.4 | T | 0.0 | 129.6 |
Remember, the snow year officially runs from July 1 through June 30. Caribou's normal snowfall is 108.7". Therefore, the above normal snowfall is representative of the kind of winter our friends in Maine experienced overall.
Here was the report from Hartford, a city just southwest of Augusta the capital and generally north of Portland....
Year
|
Jul
|
Aug
|
Sep
|
Oct
|
Nov
|
Dec
|
Jan
|
Feb
|
Mar
|
Apr
|
May
|
Jun
|
Season
|
|---|---|---|---|---|---|---|---|---|---|---|---|---|---|
| 2016-2017 | 0.0 | 0.0 | 0.0 | 0.1 | 2.1 | 37.1 | 11.6 | 62.1 | 23.0 | 11.6 | 0.0 | 0.0 | 147.6 |
In fact, there was a 62" snow depth that set a record dating back to 1998, when this station first started recording data.
Certainly, this made our winter look even more dismal in comparison.
Oh, well. Something to cool you off with nonetheless.
Have a good week...
MS
Monday, July 10, 2017
MikJournal Monday 07/10/17...Summer Records
Good morning. Today, I want to talk about records in the summer.
Records are made to be broken. Here in central Kentucky, I ask, "What records?"
In what has been a relatively wet summer for many, this has been a rather uneventful summer for broken records so far.
We have had a couple of cool mornings, but no record breakers. We have seen some rainy days. Just ask Lexington whose 3.16" on a day in June would seemingly be good enough for some type of daily record. Nope. How about Bowling Green whose summer has nearly 11" already? Not a single day of record rainfall. Record high temperatures...anyone? Hey, we got a winner, well, sort of. Oh, Louisville, a record tying high of 94 on June 14. Is that it?
Well, in western Kentucky, Paducah did register a record daily rainfall of 2.82" on June 18th.
In eastern Kentucky, Jackson and London have registered a few more records related to daily rainfall. But, remember, Jackson's weather history only dates back to about 35 years. Therefore, their 3 days of daily rainfall records on the 5th, 13th, and the 19th days of June would not take much to break. The highest amount of rainfall for any given day was 1.72" on the 19th. And Lexington's 3.16" was not a record? Well, their records date back to 1872. Jackson dates back to 1981 and London to 1954.
So much for daily records. How about monthly records? Well, we already have one month of summer in the books. How did we do?
Bowling Green's 7.93" for the month of June came in at #9 of all June's dating back to 1870.
That's it for central Kentucky. So, what about other parts of the state? That would be a no for western Kentucky. But, surely we can find some monthly records for the 'newbies' in eastern Kentucky.
Yes, we can! Jackson's 6.21" of June's liquid bliss comes in at #10 out of a mere 36 years of recordable history.
Let's switch gears just a bit by turning our attention to severe weather in the summer. Last June, in 2016, here's what Kentucky recorded...

----------------------------------
Now, let's fast-forward to the near present, to June 2017.
Well, oomph. I am writing this post on the fly, and I have no map for June 2017 yet as it has not been fully updated. Through the 27th, we had...
Keep in mind, there were some local storm reports after the 27th. But, clearly, the number of storm reports looks to be much less this June than last June.
Interestingly, last year, Kentucky came in at #4 for wind damage reports nationwide. By the way, this was not just for the summer months, but for the whole 2016 calendar year.
I'm sure some more records will be broken this summer and the rest of the year. but, so far this is a yawning period compared to the multi-month records and/or multi-top ten events of the past year or so.
Time for me to dice up some more yellow squash, zucchini, and a couple of peppers. Looking forward to picking out a couple of green tomatoes this week. Fried green tomatoes here I come. If you haven't tried this yet, place a fried green tomato rolled in a horseradish mixture as a topping for your burgers. Makes for a much more lively flavor. Yummy, indeed.
MS
Records are made to be broken. Here in central Kentucky, I ask, "What records?"
In what has been a relatively wet summer for many, this has been a rather uneventful summer for broken records so far.
We have had a couple of cool mornings, but no record breakers. We have seen some rainy days. Just ask Lexington whose 3.16" on a day in June would seemingly be good enough for some type of daily record. Nope. How about Bowling Green whose summer has nearly 11" already? Not a single day of record rainfall. Record high temperatures...anyone? Hey, we got a winner, well, sort of. Oh, Louisville, a record tying high of 94 on June 14. Is that it?
Well, in western Kentucky, Paducah did register a record daily rainfall of 2.82" on June 18th.
In eastern Kentucky, Jackson and London have registered a few more records related to daily rainfall. But, remember, Jackson's weather history only dates back to about 35 years. Therefore, their 3 days of daily rainfall records on the 5th, 13th, and the 19th days of June would not take much to break. The highest amount of rainfall for any given day was 1.72" on the 19th. And Lexington's 3.16" was not a record? Well, their records date back to 1872. Jackson dates back to 1981 and London to 1954.
So much for daily records. How about monthly records? Well, we already have one month of summer in the books. How did we do?
Bowling Green's 7.93" for the month of June came in at #9 of all June's dating back to 1870.
That's it for central Kentucky. So, what about other parts of the state? That would be a no for western Kentucky. But, surely we can find some monthly records for the 'newbies' in eastern Kentucky.
Yes, we can! Jackson's 6.21" of June's liquid bliss comes in at #10 out of a mere 36 years of recordable history.
Let's switch gears just a bit by turning our attention to severe weather in the summer. Last June, in 2016, here's what Kentucky recorded...
| Total Reports = 138 |
| Tornadoes = 0 |
| Hail Reports = 5 |
| Wind Reports = 133 |
Now, let's fast-forward to the near present, to June 2017.
Well, oomph. I am writing this post on the fly, and I have no map for June 2017 yet as it has not been fully updated. Through the 27th, we had...
| Total Reports = 45 |
| Tornadoes = 2 |
| Hail Reports = 0 |
| Wind Reports = 43 |
Keep in mind, there were some local storm reports after the 27th. But, clearly, the number of storm reports looks to be much less this June than last June.
Interestingly, last year, Kentucky came in at #4 for wind damage reports nationwide. By the way, this was not just for the summer months, but for the whole 2016 calendar year.
I'm sure some more records will be broken this summer and the rest of the year. but, so far this is a yawning period compared to the multi-month records and/or multi-top ten events of the past year or so.
Time for me to dice up some more yellow squash, zucchini, and a couple of peppers. Looking forward to picking out a couple of green tomatoes this week. Fried green tomatoes here I come. If you haven't tried this yet, place a fried green tomato rolled in a horseradish mixture as a topping for your burgers. Makes for a much more lively flavor. Yummy, indeed.
MS
Friday, July 7, 2017
I'm Calling You Out
From time to time, I find something that I do not like when it comes to weather observations, recording data, whether it be visual observations like mistaking a funnel for a scud cloud or measuring snowfall on a deck next to the grill and chair; the recording of data that use automated sensors for precipitation and temperature.
This rant includes a couple of new entries.
First, I saw a discussion from the NWS Louisville that highlighted the heavy rainfall in and around the Louisville Metro area yesterday and named the Billtown Road Pumping Station with the highest amount. Using data from often reliable sources such as MSD telemetered gages throughout the region, we can often get a better understanding on the scope of the rainfall compared to other areas.
Well, I have to call out the MSD pumping station at Billtown Road. There is something wrong about their rain gage. I don't know what it is, but it is not accurate. It seems for every rain event we have in the county, the Billtown pumping station gage nearly always records the most in the county.
So, I looked up some data recordings from the period of March 1 through the present and found an eye-opening statistic that really deserves extra analysis from the 'professionals' about their equipment.
Since March 1, the Billtown Pumping Station has recorded over 30". The next highest measurement comes from outside of the county at like 22 or 23". Most areas are in the vicinity of 16-19" in Jefferson County.
Next, I have used the Acurite manual rain gauge for years. I have often relayed these measurements to other local media, reporting my observations. I know others use the Acurite rain gage as well.
Well, I made my own rain gauge, using a Barilla Spaghetti jar. Using a funnel that is the exact size of the opening, I collect the rainfall.
Of course, this rain gauge has its flaws. It has a curved feature at the bottom that requires a couple of readings to average out the measurements. It takes nearly 0.06-0.07" just to cover the bottom to record a measurement. Estimates less than this have to be performed, which is not always accurate.Values up to 0.50" have to include built-in error numbers as well. However, the more rainfall I have in the gage, the more accurate it becomes.
Based on surrounding, what I call reliable MSD telemetered rain gages, I consult the values during a 'uniform' rain event and compare my numbers. They often fall right in there with their numbers. Therefore, I can say with certainty that my measurement will not be more than 0.04" off, including estimates and recorded measurements.
However, I was surprised when I placed my Acurite rain gage next to my homemade rain gage. A preliminary analysis has revealed an unsettling concern.
To the makers of Acurite, I am calling you out. I am still recording my observations; therefore, my findings are not conclusive. This preliminary analysis, though, reveals that the higher the rainfall amounts, the higher the discrepancy between a homemade rain gage that will not be off by more than 0.04" and your product.
Here are a few examples. I recorded 0.33" from my homemade rain gage just last week. However, the Acurite measured a little bit higher, at about 0.38". Yesterday, I measured 0.95" in the homemade rain gage while Acurite measured 1.24-1.25". Finally, during the remnants of Cindy last month, I collected 1.66" in my homemade rain gage. Acurite recorded about 2.10".
Yes, it is possible that my homemade rain gage may have some underlying issue that I have yet to uncover. But, when I use surrounding data sensors, my values are in better agreement than the Acurite numbers.
MS
Tuesday, July 4, 2017
Oops Moment...Weather History and U.S. History
Here is a quote from the This Date in Weather/Climate History page....
I appreciated the weather history from July 4, 1776 about Thomas Jefferson's thermometer reading of 76 degrees at 1:00 p.m. He was an avid weather enthusiast, making periodic observations and recording them in a journal.
However, the document was not signed on July 4, as is the common misconception. Congress did approve of the final text on this date. The president of the Congress, John Hancock, and the secretary of the Congress, Charles Thompson, signed off on it, giving it official approval.
The actual signing of the Declaration by 56 congressional delegates would not take place until August 2.
Did you know the Declaration of Independence has a historical connection with Kentucky? Well, not in the late 1700's. But, here is a bit of history you may not have heard or read....
http://www.history.com/this-day-in-history/delegates-sign-declaration-of-independence
http://www.history.com/news/9-things-you-may-not-know-about-the-declaration-of-independence
https://www.constitutionfacts.com/us-declaration-of-independence/fascinating-facts/
MS
July 4th, 1776 - Thomas Jefferson purchased a thermometer from a local merchant before signing the Declaration of Independence. According to his weather memorandum book, at 1 PM it was cloudy and 76 degrees.
I appreciated the weather history from July 4, 1776 about Thomas Jefferson's thermometer reading of 76 degrees at 1:00 p.m. He was an avid weather enthusiast, making periodic observations and recording them in a journal.
However, the document was not signed on July 4, as is the common misconception. Congress did approve of the final text on this date. The president of the Congress, John Hancock, and the secretary of the Congress, Charles Thompson, signed off on it, giving it official approval.
The actual signing of the Declaration by 56 congressional delegates would not take place until August 2.
Did you know the Declaration of Independence has a historical connection with Kentucky? Well, not in the late 1700's. But, here is a bit of history you may not have heard or read....
On December 23, 1941, just over two weeks after the Japanese attack on Pearl Harbor, the signed Declaration, together with the Constitution, was removed from public display and prepared for evacuation out of Washington, D.C. Under the supervision of armed guards, the founding document was packed in a specially designed container, latched with padlocks, sealed with lead and placed in a larger box. All told, 150 pounds of protective gear surrounded the parchment. On December 26 and 27, accompanied by Secret Service agents, it traveled by train to Louisville, Kentucky, where a cavalry troop of the 13th Armored Division escorted it to Fort Knox. The Declaration was returned to Washington, D.C., in 1944.References:
http://www.history.com/this-day-in-history/delegates-sign-declaration-of-independence
http://www.history.com/news/9-things-you-may-not-know-about-the-declaration-of-independence
https://www.constitutionfacts.com/us-declaration-of-independence/fascinating-facts/
MS
Monday, July 3, 2017
MikJournal Monday 07/03/2017...Severe Storm Reports Waning?
Good morning, everyone. If you're enjoying an 'extended' weekend, good for you. If not, there's always tomorrow...for many, except me. But, that's okay.
My garden is doing well overall. Tomatoes are getting bigger, not quite ready for picking just yet since there are no red ones, but at least the green ones are getting there. Come on fried green tomatoes! The yellow squash and zucchini plants are cranking out the produce. I have to dice several today and prepare them for the freezer. We've already enjoyed fried squash and zucchini using Panko Bread crumbs, and last night, we had sautéed squash and zucchini in olive oil and Italian seasonings along with grated parmesan cheese as a complement to our sub sandwiches. The chili peppers are medium hot, not too bad. But, I'm awaiting the habanero produce so that I can get out my dip recipe and enjoy some real heat.
Speaking of heat, wow, the deserts of the southwestern United States have had some high heat already this summer.
Death Valley CA has hit 127 degrees twice this season. Las Vegas NV recorded a record high of 117 degrees on June 20 and as of yesterday has reached at least 100 degrees every day since June 15. Needles CA had an average temperature of 109 degrees on the 25th. Yes, a high of 123 and a low of 94. In fact the average temperature (high temp + low temp then divide by 2) of 100 degrees or higher occurred during a stretch from the 17th through the 27th. And this was just June. We still have July and August.
Looking at July, I found this eye-opening graph of normally expected precipitation for the contiguous United States during the month....
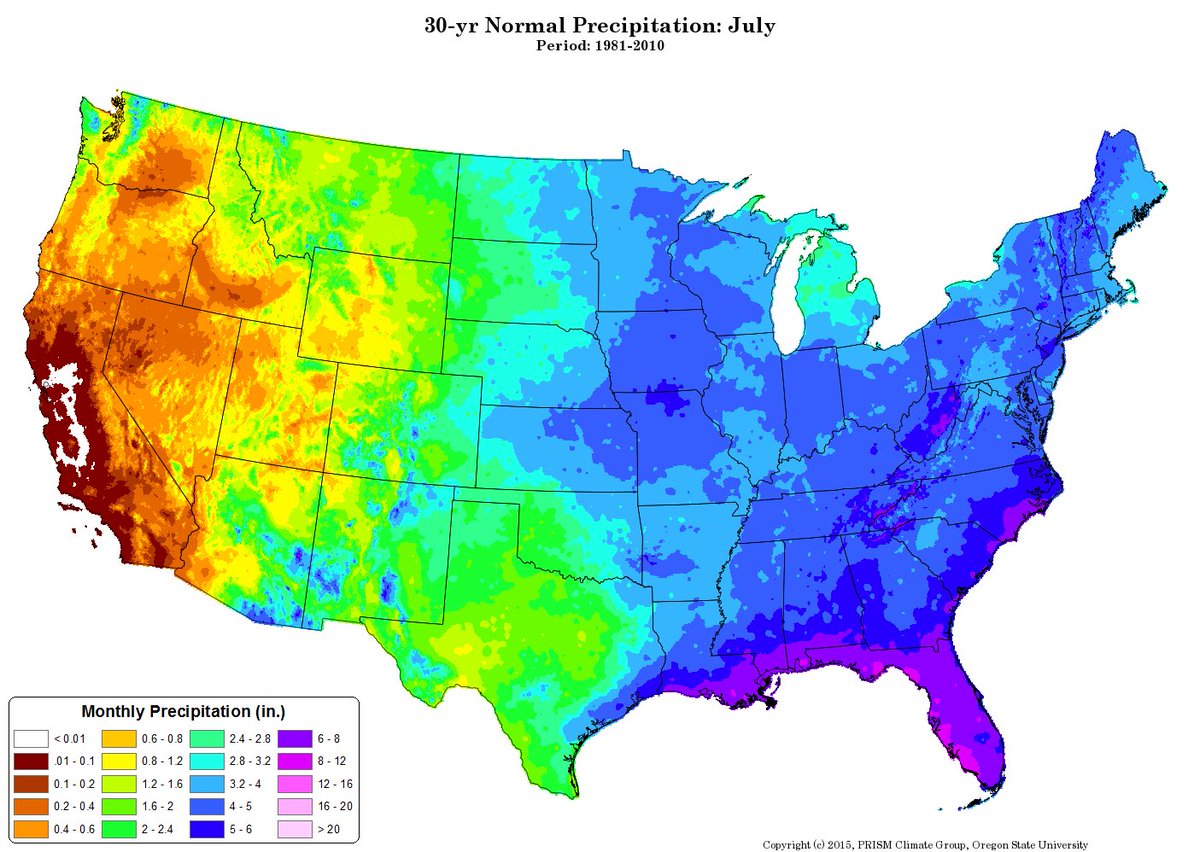
Check out the white areas of central California. Yes, during the 30 years of 1981-2010, the average precipitation for this region was absolutely zero inches, or it could have been a trace but not enough to measure.
Now, I want to take a moment to update you on how active this severe weather year has been, especially regarding tornadoes per the chart below. It is still trending above normal, but has definitely slowed down recently. With the loss of La Nina, tornado reports should remain on cruise control from here.
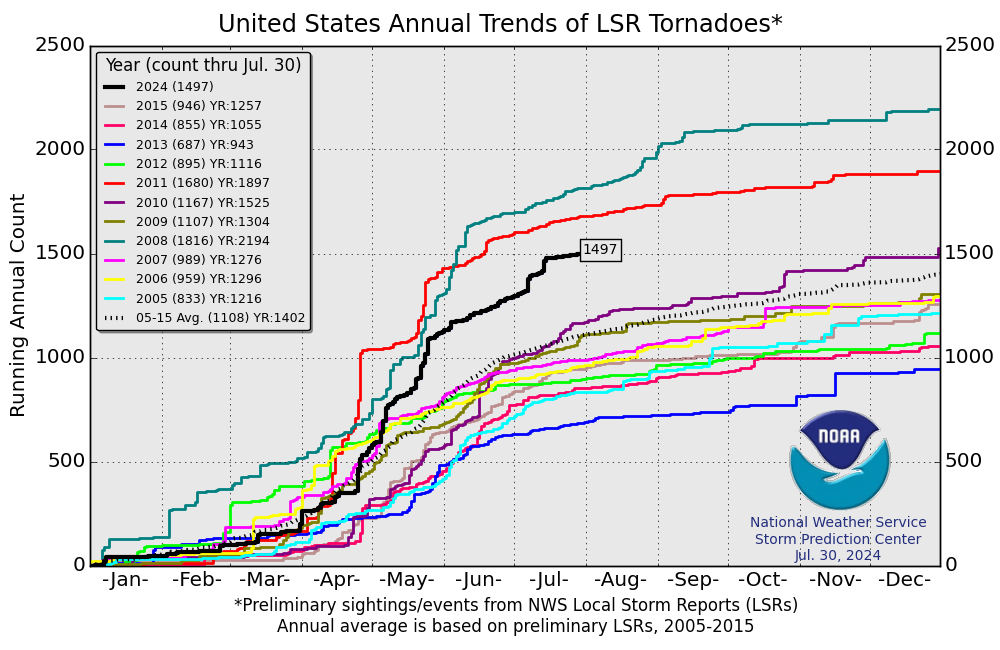
What does that mean going forward? I'm projecting a similar total compared to 2010's 3rd ranked most active tornado year during the 2005-2015 chart above. Yes, it looks like an above normal year. Hopefully, and more importantly, let's hope the killer tornadoes are done for the year. The 34 deaths from this year are just 2 shy of 2015's 36 deaths.
One final reminder. We are getting into the heart of boating season. Pay attention to the weather. Getting caught out in the water during a thunderstorm is not smart.
MS
My garden is doing well overall. Tomatoes are getting bigger, not quite ready for picking just yet since there are no red ones, but at least the green ones are getting there. Come on fried green tomatoes! The yellow squash and zucchini plants are cranking out the produce. I have to dice several today and prepare them for the freezer. We've already enjoyed fried squash and zucchini using Panko Bread crumbs, and last night, we had sautéed squash and zucchini in olive oil and Italian seasonings along with grated parmesan cheese as a complement to our sub sandwiches. The chili peppers are medium hot, not too bad. But, I'm awaiting the habanero produce so that I can get out my dip recipe and enjoy some real heat.
Speaking of heat, wow, the deserts of the southwestern United States have had some high heat already this summer.
Death Valley CA has hit 127 degrees twice this season. Las Vegas NV recorded a record high of 117 degrees on June 20 and as of yesterday has reached at least 100 degrees every day since June 15. Needles CA had an average temperature of 109 degrees on the 25th. Yes, a high of 123 and a low of 94. In fact the average temperature (high temp + low temp then divide by 2) of 100 degrees or higher occurred during a stretch from the 17th through the 27th. And this was just June. We still have July and August.
Looking at July, I found this eye-opening graph of normally expected precipitation for the contiguous United States during the month....
Check out the white areas of central California. Yes, during the 30 years of 1981-2010, the average precipitation for this region was absolutely zero inches, or it could have been a trace but not enough to measure.
Now, I want to take a moment to update you on how active this severe weather year has been, especially regarding tornadoes per the chart below. It is still trending above normal, but has definitely slowed down recently. With the loss of La Nina, tornado reports should remain on cruise control from here.
What does that mean going forward? I'm projecting a similar total compared to 2010's 3rd ranked most active tornado year during the 2005-2015 chart above. Yes, it looks like an above normal year. Hopefully, and more importantly, let's hope the killer tornadoes are done for the year. The 34 deaths from this year are just 2 shy of 2015's 36 deaths.
One final reminder. We are getting into the heart of boating season. Pay attention to the weather. Getting caught out in the water during a thunderstorm is not smart.
MS
Saturday, July 1, 2017
Snow Year Ending 06/30/2017 Is Louisville's Lowest Since 1988-1989
Well, it's finally official. Yes, the snow year ended June 30, making this past winter's 2.7" the least snowy for Louisville since 1988-1989 when only 0.9" was recorded.
Lexington's 3.4" is the lowest amount of snowfall since the 1991-1992 total of 3.2".
Jackson's 4.8" is the lowest amount since records have been kept, beginning in 1981-1982.
Paducah recorded 1.2" thanks in large part to a 'back loaded winter' snow event in March when 1.0" accumulated for the month. The 2016/2017 winter was the least amount of snow since 2011/2012 but could have easily been the least since 1991/1992 when only a trace amount was recorded.
MS
Subscribe to:
Posts (Atom)
-
Recently, I noticed that our days have now begun to shorten. However, our sunset here in Louisville still remains at 9:10pm edt. Starting th...
-
 In July of this year, I did a segment about the latest sunsets in the eastern time zone. This corresponded nicely with the summer solstice a...
 -
A 1 Temperature C Humidity F Heat Index 2 81 82 86.82 This is an Excel spreadsheet program. Fairly ...
