Monday, November 20, 2017

MikJournal Monday 11/20/2017...Another Stormy Weekend

Good Monday morning. Residents across parts of Kentucky are still reeling from storm damage as the result of a second bout of severe weather this month. As of this post, 2 confirmed tornadoes have now been assessed by the NWS during this latest installment of severe weather season part 2. Both tornadoes caused EF-1 damage. One was near Beaver Dam in Ohio County and the other was in Meade County near Guston.

Locally, at least in my neighborhood here in Valley Station, we fared somewhat better than the first bout of severe weather two weeks ago. Winds still were gusty all day long with peak gusts approaching 45 mph. But, no significant damage was found this time. Actually, damage from 2 weeks ago was not caused by severe thunderstorms but gradient winds with periodic gusts from 50-55 mph.

The intense line of thunderstorms raced eastward at speeds of at least 50 mph. Warnings were issued just west and southwest of my locations for potential wind gusts of 70 mph. As the line moved in, I was expecting a gusty rain shower. Instead, I got nearly the opposite. The skies momentarily brightened and winds actually abated. Yet, I can hear the roar of winds or heavy rain nearby similar to the distant sound of fast-moving traffic from an interstate. It was almost kind of eerie.

No snowflakes here. I really wasn't expecting any. But, the winds were quite brisk yesterday, easily negating any warmth from the sunshine. By the time I woke up this morning, I had a low temperature of 23 degrees and a thick frost. I even found some upper teens on the Kentucky Mesonet site.

Now, for the week ahead. Teleconnection signals still do not favor any type of wintry weather for the region. Yes, overall, we should still expect below normal temperatures, but not anything that unusual for the latter part of November.

The latest Euro run through next Monday keeps the coldest air to our north and northeast. However, shots of cold air are still going to affect the region, just not as cold as they could be.

The coldest air idea could be contingent on whether we establish any type of long-duration blocking near Greenland. So far, the GFS keeps waffling on this idea. A more negative NAO could help drive the coldest air more southward instead of north and northeastward. Nevertheless, we are still going to be affected by the cold air with mostly below normal readings.

For the period of November 25-December 03, temperatures are expected to range from near normal to below normal while precipitation is mostly below normal, according to the latest CPC outlook.

Longer range, the latest CPC outlook dated November 16 has the winter months of December through February coming in near normal to above normal while precipitation looks to be above normal for our region.

Last year on this date, we recorded a low of 27 degrees at Louisville International for its coldest reading for the month, that after a balmy 81 degree high on the 18th, just a couple of days earlier. Other locations in the state would see lows in the upper teens a couple of days later, like the 21st and the 22nd. So, really, it is not unusual to have cold mornings like this in November, not a big deal.

For you weather geeks out there who pay attention to October snow cover extent for forecasting the upcoming winter, there was another above normal reading for Eurasia...


In fact, this marked the 6th consecutive year of above normal anomalies.

The Northern Hemisphere SCE was the 9th largest out of the 50-yr record, nearly 21 percent above the 1981-2010 average. They too had a 6th consecutive above normal anomaly.

This should bode well for us snow lovers here in the United States. But, who and where will see the most snow this winter? There will be regions that see above normal snowfall this winter. Yet, we have to remember the drivers for this upcoming winter will ultimately determine the end result.

Remember last winter. We barely saw anything at all despite an above normal October Snow Cover Extent. Yet, some places were absolutely hammered, like the West and Northwest and parts of the Northeast. The have's and the have not's will be a feature of this upcoming winter as well.

That is all for now. Have a great week. Keep checking back as I continue gathering more data for the upcoming winter. I'm nearly ready to offer my brief winter outlook and in-depth December outlook soon.

MS


Thursday, November 16, 2017

MikJournal Midweek 11/16/2017... A Lot of Data


Good afternoon. My expected midweek post was a little bit delayed. I had an influx of data to pore over and did not have time to write much of it out .

The map above is another winter weather prediction, this time from Dr. Judah Cohen, from AER (Atmospheric and Environmental Research). He has an interesting take on winter forecasting, using just a few main variables that occur during the Fall, and makes predictions how the atmosphere (both troposphere and stratosphere) will adjust to the known variables in play. Arctic sea ice levels and October Eurasian snow cover extent are just a couple of players he looks at in his forecast. You can find his winter weather forecast here.

In the meantime, I was looking over some data for the state of Kentucky during October. Did you know our state had its 9th wettest October during the last 123 years?

Lexington and Frankfort contributed to that statistic by recording top ten wettest Octobers.

Mesonet sites in Muhlenberg and Ohio counties recorded double-digit amounts at 12.16 and 10.01" respectively.

Teleconnections have been all over the place during the past few days. No clear and definable trend has led me to believe there is not much support for any winter storm for our region during the holiday period. Still, with projected normal to below normal readings, one cannot rule out some nearby snowflakes, but nothing that would impact travel at least here.

Although we cannot rule out isolated severe thunderstorms during the next storm system, no widespread severe weather is expected. But, gradient winds can do just as much damage, as was evidenced during last weekend's bout here in Louisville, where winds reached 50-55 mph.

Analogs do support a heavy rain threat, with 1" amounts likely. WPC suggests 0.50 - 1.00" for central and eastern Kentucky during the next few days.

Everyone who reads the journal regularly knows I like to make projections about monthly temperatures and/or precipitation.

Well, temperatures are about to go below normal for the month. How will we finish? We could be looking at a below normal November unless we have a few well-above normal temperature days. But, like I said earlier, through the holiday week, we are expecting near normal to below normal readings to persist.

More updates this weekend if necessary.

MS


Monday, November 13, 2017

MikJournal Monday 11/13/2017...Rollercoaster Weather

Good Monday to ya! A little dreary outside my place this morning with temperatures in the low 40's and a fairly high barometric pressure reading of 30.45". For you weather geeks like me, convert that to millibars (what you typically find on a weather map) by multiplying the inches of mercury by 33.8638815...and you have about 1031 millibars (mb), a fairly stout high pressure reading. By the way, the record highest pressure reading at Louisville is 30.98", or 1049 mb tied on February 12, 1981 and initially set on January 6, 1924. Okay, while I am on the subject, the lowest reading for Louisville is 28.93" (~980 mb) set also in the month of February on the 28th in the year 1902. And the only other time a barometric pressure reading dipped below 29" of mercury was February 10, 1960 at 28.98" (or 981 mb), good enough for a strong Category 1 hurricane. Thank you NWS Louisville for providing us with the numbers.

Typically, in the late Fall and Winter, high barometric pressure readings originate in the Arctic regions that slide southward and obviously carry much colder air. Again you weather geeks know that cold air sinks. In addition, as the air sinks, it warms (relatively) and expands, exerting a higher pressure at the surface and dries out the atmosphere just above the surface. So, often you have fair and cold weather associated with such areas of high pressure. For example, the February 12, 1981 temperature at Louisville (the day we recorded the highest pressure reading of 30.98") was 21 degrees for a high temperature and 0 degrees for an overnight low.

I provide this brief, amateur definition of high pressure because you will probably be exposed to pressure readings this week. The relatively high pressure today will be replaced by a monster low pressure system later this week. I have read and heard that the pressure readings associated with this low pressure may reach 990 millibars, or about 29.25" of mercury. That's a pretty strong storm system and will likely carry a lot of wind ( a result of difference between high and low pressure). The warmer air ahead of it will be pumped into our region via the Gulf of Mexico. Then, post-frontal winds will crank from the northwest and usher in much colder air, coming from the Arctic region. This setup provides a classic battle between warmth and cold and has potential to produce some high octane storms for our region later this week. Stay tuned.

As of today, we are still above normal in the temperature department. The Climate Prediction Center gave a fairly accurate outlook for our region through the 12th that temperatures would average out above normal for the first 12 days of the month. Well, how about the next 2 weeks?

The outlook for November 18-26 (most of this week not included) calls for a higher percentage of being below normal in the temperature department and near normal to below normal in the precipitation department for Kentucky.

A preliminary outlook for this week from the Weather Prediction Center through next Monday morning is for rainfall amounts to be in a range of 0.25" to about 1.00" statewide. Of course, these values are subject to change as upper air readings will be sampled throughout the week to determine how this volatile week will eventually unfold in our region.

No really significant extremes in temperatures yesterday. The highest reading was 89 degrees at Tucson AZ and lowest reading was 0 degrees at Bottineau ND.

One feature I like to look at is the temperatures in Alaska. The coldest temperature was -9 at Gulkana yesterday. That's not bad for them. Fairbanks has not recorded a below normal day yet this month. They are running over 12 degrees above normal so far. The outlook from the CPC has northern Alaska at above normal through the 26th while below normal for the central and southern parts of the state.

That should allow for chunks of cold air to reach our area. However, the air is still not truly 'Arctic' yet. Even Siberia is forecast to be above normal. That does not mean swimsuit weather. However, a weak polar vortex can still send down very cold air, at least according to our standards, even modified Arctic air.

I am currently working on a brief regional outlook for the winter as well as a December outlook. Please note I will not be posting seasonal snow totals again for this upcoming winter, since there is no sound basis for making such forecasts. However, I am posting a percentage factor similar to how the CPC provides in their outlooks for temperature and precipitation. Such outlooks will provide odds of above normal, near normal, and below normal categories.

A little preview for you. I do have a higher than average chance for ice (that is regular rain falling on ground at or below 32 degrees, not sleet) for the state. Also, a higher than average chance for above normal snowfall at localized areas of the state. Stay tuned.

Also, another little morsel. I like to follow teleconnection signals such as the Arctic Oscillation and Pacific North American. Well, I follow about 4 of these signals. They all have to be in agreement to support an increased chance for wintry weather. Admittedly, it may still be too early in the season to be incorporating such signals in a forecast. But, if this was late December/January, I would be getting really excited. Nearly all 4 signals are supporting a chance for wintry weather. There is one that is still oscillating, no pun intended. But, one of the signals is a bullish call for wintry weather later this month. Keep an eye on the trend. That's what I want to do.

I will be posting a mid-week report about the second half of the month in detail. Until then, signing off.

MS


Monday, November 6, 2017

MikJournal Monday 11/06/2017...Severe Weather Season Part 2

Welcome to my journal this Monday morning. This guy had a long night, so Monday morning came early in 2 ways. I was up after midnight already with winds still rather gusty but calming down from an hour earlier when wind speeds at my house exceeded 50 mph, knocking power out to nearby subdivisions. I didn't get to bed until nearly 2:00 a.m. due to working with a couple of my neighbors in clearing our road of my neighbor's large limb that measured at least 8" in diameter at the fork and at least 30 feet in length. Then, 6:00 a.m. is what time I normally would rise and shine. Uh, yeah, right. Too early. Went back to bed for another hour.

There were no severe thunderstorm warnings issued by the NWS Louisville. At first, I could not understand why. I had only been asleep for about 30 minutes when I heard the winds roaring outside my window. I stepped out on the back porch and was impressed by the winds. However, there was no rain and no lightning. Yet, we were experiencing winds in excess of 50 mph along with regular gusts of 40-50 mph for up to 20-30 minutes. Quite a long time for even a severe thunderstorm.

Radar showed a band of storms just to my southwest and another band just north and northwest of my area. The NWS would call these high gusts of winds 'gradient winds'. Too much science this early in the day to try and explain. Yawn. Anyway, I had thought that perhaps a decaying line of nearby storms contributed to a rush of winds reaching the surface. But, even that would not typically last 30 minutes.

Here is a brief look at highest winds recorded around the state..


This event has proven to be the most damage my area has seen this year. And technically, it was not a storm. Any rain that would fall was well after I finally fell asleep and only amounted to a meager 0.03". Add that to the 0.01" between 10 and 11 p.m. last night and I have a drenching total of 0.04". Forecast for my area was about 0.75" to 1.00". However, there was a thin west to east line several miles long but only a few miles thick that registered similar amounts or recorded no rainfall at all. What a weird night.

Most of our region escaped severe thunderstorms. There were a couple of wind reports in western Kentucky. In southern Indiana, NWS survey teams are going to check out Washington and Orange counties to determine any tornadic signatures and damage. The bulk of the severe weather stayed mostly along and north of Indianapolis to Cleveland to parts of Pennsylvania.

Temperatures yesterday were very warm. Dewpoints in the 60's added a little more stickiness to the air, except the winds helped to alleviate that quite a bit. Louisville reached a high of 78. I saw a Mesonet site showing 80 degrees down state.

It appears that the next several days should feature below normal readings to help offset the blistering start to the month...ok, maybe not blistering, but still well above average.

However, I do not see any snowflakes in the near future. Teleconnections show a trough west ridge east type setup or at the very least a zonal component for the next week or so, which should bar any significant cold air intrusions that would have any staying power. So, low temperatures in the 20's and 30's is not unusual for November, just a shock to the senses after the nice weather we've had over the last few days.

As for extreme weather, I leave you with the findings of what caused the failure of Kelley Barnes Dam at Toccoa Falls, Georgia on November 6, 1977...
Dam Failure

National Weather Extremes...

November 06...
2006 - Nehalem, OR...11.77" (state 24-hr precipitation record)

November 11-12...
1980 - Key West Int'l Airport, FL...23.28" (official state 24-hr precipitation record)

Have a good week. Hopefully, a little more tranquil.

MS

Wednesday, November 1, 2017

MikJournal Midweek 11/01/2017...Welcome To November

Thanks for dropping by. Usually, I do not write a midweek post, but this is the beginning of another month. Let's try and see how the month of November could affect our region.

Louisville's average temperature:
November 1 high - 65
November 1 low - 44

November 30 high - 51
November 30 low - 34

Highest November temperature: 85 degrees (set last year on November 1 and 2)
Lowest November temperature: -1 degrees in 1950 on November 25

Average total snowfall by November 30 - 0.2"

Highest snowfall total by November 30 (starting from July 1 beginning of snow year) - 13.2" (1966)

Sunrise/Sunset times
November 1 - 8:09am/6:43pm...10 hrs 34 min.
November 30 - 7:40am/5:23pm...9 hrs 43 min.

This is just data I like to provide to help you understand how much shorter are the daylight hours compared to last month. And the colder weather that often accompanies these shorter days.

Here is another interesting statistic: cloud cover
During the past couple of years, the months of January and February, which often contributes to a cold feeling day, have been the cloudiest here in Louisville. However, if we get a few days of solid cloud cover as a result of some inversion, which can happen this time of year, cold air can become trapped and take longer to burn off since the sun angle is so much lower.

Also, I have now included a couple more seasonal items on the side of the blog:
AER (atmospheric and environmental research) discusses the Arctic Oscillation, a significant player in the winter months.

Teleconnections shows a forecast at the 500mb level for other potential drivers/players of the winter season such as the EPO, NAO, PNA.

For the first part of November, I am still looking at a milder and wetter pattern compared to normal for our region at least through the 12th. Afterward, we might see another pattern change that may introduce colder air intrusions.

Weak La Nina is still expected for the upcoming winter season. However, weather patterns are different than last year about this time when a weak La Nina was about to commence. It's all about timing of weather systems and what drives them.

If we have many troughs that get cut off from the jet stream, weather systems will not be as progressive. However, last winter, our region was in a peak, or high point, while the west and northeast were in a valley, or low point.

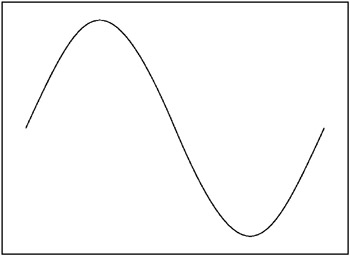
Image result for sine wave picture


This winter, the progression of weather systems should put us in an upward slope. Depending on the amount of cold air and strength of weather systems, the sine wave could be compressed with lots of valleys and peaks resulting in numerous chances for precipitation in our region. Often, with compressed sine waves, we have stronger storm systems that typically 'warm us up' just before frontal passage and backside snows with the post-frontal passage.

What I am trying to say here is if you are a snow lover, stay tuned. An upward slope is what you want. If we can get just a normal system in here a few times this winter, I think many of us will be happy. The downside is that a stronger storm system follows a path that keeps the heaviest wintry precipitation to our west and north. That has happened here in our region several times over the years.

But, I'll focus more on that in a future post. Just whetting your appetite.

MS


Tornadoes on Easter Sunday

This is a worse case scenario. Tornadoes and flooded, blocked roadways making for great difficulties reaching residences affecting hard hit ...