Sunday, July 31, 2011

Looking At the Tropics...

Aug 1 4:30am UPDATE
Not reporting anything new, just wanted to share this map with you. After all of this time of following tropical systems, I still cannot keep the windward and leeward islands straight. These form most of the Lesser Antilles.

------------------------------------------------------
Aug 1 3:30am UPDATE
Still no definitive surface circulation but hurricane hunters heading out there this morning. For those living near the Lesser Antilles, treat this as a tropical storm threat. I continue to see circulation at least in the upper levels near 14.4N and 55.9W moving at about 15mph west and northwest. This puts it about 370 miles east-southeast of Dominica and 340 miles due east of Martinique. Therefore, expect possible tropical storm conditions within 24 hours despite no official watches or warnings.
----------------------------------------
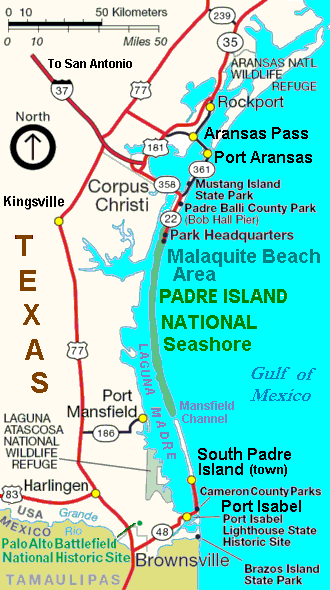
After the complete disintegration of Don near Baffin Bay in south Texas late Friday night and early Saturday morning, we have been turning our attention once again eastward, this time toward the Lesser Antilles.

As of the latest report, although hurricane hunters have not clearly defined surface circulation, satellite imagery shows spin with the latest center of upper level circulation near 14.1N and 53.5W (6:15pm edt) moving west at about 16 mph.

By the next report, hopefully around 7:45pm edt, we'll have at least a tropical depression, if not our next named storm called Emily. That means I'll be using the satellite image from 7:15pm and should show coordinates in the upper levels at 14.2N and 53.7W.

We'll see what the next tropical update reveals....

Otherwise, an upper level low is crossing over southern parts of Cuba, but no tropical development is expected from the NHC.

MS

How Hot Was This July??? Regionwide

Thanks to the NWS office here in Louisville for verification of our 80+ degree dewpoints. I calculated 19 hours of at least 80 degree dewpoint readings and they provided the verifiable data below...

Date
    Time (UTC)
Td
07/11/11
21:56
80
07/11/11
22:56
80
07/11/11
23:56
80
07/12/11
0:56
80
07/12/11
1:56
80
07/12/11
2:56
80
07/12/11
3:56
80
07/12/11
4:56
80
07/12/11
5:56
80
07/12/11
6:56
80
07/12/11
7:56
80
07/12/11
8:56
80
07/12/11
9:56
80
07/12/11
10:56
80
07/12/11
11:56
81
07/12/11
12:56
81
07/12/11
13:56
81
07/20/11
16:56
80
07/20/11
18:56
80


Speaking of the NWS office in Louisville, on their Web page, check out the number of consecutive days we have been in the 90's and their current forecast for the next several days. There is a chance we could see another record, this one for most consecutive days in the 90's, which currently stands at 22. Click HERE.

I've mentioned in a previous post that Louisville could see its 3rd hottest July on record after today. This will replace last year's 3rd hottest year position.

Let's take a look at other locations in our region...
Lexington - looks to see their 8-9th warmest July on record
Frankfort - 10th warmest July on record
Bowling Green - 5-6th warmest July on record

Indianapolis will possibly close in on their hottest month in 75 years.
Also, it may be their driest July on record!

MS

Saturday, July 30, 2011

How Hot Was This July??? What About August?

It was so hot...(audience asks, "how hot was it?"). Well, it was so hot this month in Louisville that July 2011 should go down in the record books as the 3rd hottest July on record, even replacing 2010's previous 3rd place position.

Today's high has surpassed 90 degrees, making this the 14th consecutive day at or above 90. This also marks the 23rd day in the 90's for this month. After tomorrow, as the temperature is expected to surpass 90 again, we will have nearly doubled the number of days (24) in the 90's than what is considered normal for July in Louisville. In 2010, we also reached 90 degrees 24 times in the month of July.

Louisville, Kentucky
Normal Number of Days with:
Month                   >=90       <=Low 32°      <=High 32°         <= 0°
January
0
23.1
8.2
0.9
February
0
17.8
4.5
0.2
March
0
11.1
0.6
0
April
0
2.1
0
0
May
0.6
0
0
0
June
6.5
0
0
0
July
12.3
0
0
0
August
10.4
0
0
0
September
3.4
0
0
0
October
0
1
0
0
November
0
8.7
0.2
0
December
0
18.8
4.2
0.3
YEAR
33.2
82.6
17.8
1.4


Also, how about those dewpoints? I would like to see the official tally on this stat, but I calculated at least 19 hours when the dewpoint had reached at least 80 degrees here in Louisville. I'm hoping the NWS office in Louisville can help me with that one.

Now, for the month of August, at least the first part is guaranteed to be, well, typical August hot. Some mets are talking about a shift in the heat ridge that will allow our weather to finally cool down. I can see their reasoning, but August is one of those stubborn months when heat just doesn't take a back seat. Therefore, I think the month will be hotter than what they are thinking, as has been typical with this entire summer.

Here is what the CPC is thinking for the next 6-10 days...
Also, their 8-14 day outlook...


Notice that the area of above normal heat retreats a bit to the south and the west. I'm saying that the month of August is not historically known for its large fluctuations; therefore, the heat should remain.

However, part of their thinking for the cooler weather will be a series of impulses that will ride along the heat ridge and give us more precipitation, in fact, above normal precip for the first two weeks of the month. Here is the CPC's thinking for the second week of August...


Again, the way I see it is that the heat will remain, and if we get the rains, then the humidity levels will approach levels that we saw in early July, high dewpoints and high heat indices.

MS

The Don Is Dead

Check this out from the National Hurricane Center...
"THE DON IS DEAD.  THE CYCLONE LITERALLY EVAPORATED OVER TEXAS ABOUT
AS FAST AS I HAVE EVER SEEN WITHOUT MOUNTAINS INVOLVED.  DON HAS NO
CONVECTION...MEAGER RAINFALL...AND ONLY A SLIGHT SIGNATURE IN
SURFACE OBSERVATIONS AND RADAR DATA.  THEREFORE...THIS IS THE LAST
ADVISORY ON THIS SYSTEM.  DON SHOULD OPEN UP INTO A TROUGH LATER
TODAY AS IT MOVES TO THE WEST-NORTHWEST AND IS NOT EXPECTED TO POSE
A RAINFALL THREAT."

For those who tracked this storm, it was an excellent exercise in plotting coordinates and forecasting landfall. For those who watched the RADAR like me, tracking the rain as it progressed toward shore, I thought for sure the RADAR was malfunctioning as 'ground clutter' completely obscured any rain echoes. For those who were hoping for beneficial rains, well, maybe next time. I think the cotton pickers at least appreciated the disintegration of Don.

Turned out that tropical storm Don choked on drier air that got sucked into the system. Often, this happens to hurricanes and weakens them quite a bit. Therefore, this tropical system, not impressive to begin with, did not stand a chance. Still, the storm system literally fell apart. I've never seen a tropical system just give out so quickly.

MS

Friday, July 29, 2011

Don To Make Landfall...

Tropical storm Don looks to make landfall with center of lowest pressure crossing somewhere between Baffin Bay and the northern part of the Laguna Madre. Not an impressive storm; however, the rains will be welcome. Also, as with any landfalling tropical system, isolated tornadoes cannot be ruled out.

Landfall looks to occur late tonight, possibly just after midnight. Padre Island should be the first piece of land affected, then the mainland.


MS

Keep Up With Don

Although our weather won't be directly impacted by Tropical Storm Don, it's always fun to track these systems, especially when they don't pose a huge impact to human life and property. In fact, beneficial rains will soak parts of the Lone Star state.

I've been tracking the storm and continue to hold to my initial forecast of 11pm F to 2am S landfall. I continue to use Corpus Christi as my primary feature with coordinates. However, a bit later, I will introduce other locations that could be near the center of Don's arrival.

Using the coordinates from my Excel program, I've calculated Don to be 292 miles away from Corpus Christi as of the 5:00am plot. Still some fluctuation in forward speed is expected but a midnight arrival is not entirely out of the question.

MS

Thursday, July 28, 2011

Sinkhole Insurance Premiums On the Rise

This insurer is proposing raising premiums on sinkhole insurance by as much as 400% in Florida. Some locations could see rises as much as 2000%.


Although Florida is one of the sinkhole capitals of the United States, the insurer called Citizens is taking advantage of an act of legislation that removed a rate hike cap on sinkhole insurance premiums.

Therefore, a typical sinkhole premium that costs a Tampa Bay resident $156 would rise to $3,651. Ouch!

Click here for more on this story.

MS

Tracking TS Don

I really enjoy tracking tropical systems as they migrate over water. I like to download a printable map with coordinates so I can plot the system and watch its progression. I found this downloadable and printable map here.

In addition, the generic Excel formula using the Great Circle and latitude/longitude coordinates can also be a useful tool for tracking how far the storm is from a particular part of the U.S. mainland (See post below).

In this case, I'm using Corpus Christi TX as a feature for indicating how far away the storm is from land.
The latest coordinates as of 2pm is 24.6N by 90.7W.

According to the coordinates I've used for Corpus Christi, this puts Don about 470 miles away. Allowing for slight fluctuations in forward speed, this puts landfall between 11:00pm Friday night and 2:00 a.m. Saturday morning. Of course, this is subject to change.

The most important thing about Don at this point is it will be a soaker of a system for parts of 'thirsty' Texas. Not quite drought-busting, but this will help a lot.

MS

Wednesday, July 27, 2011

Do You Like Science? Great Circle Formula w/ Lat and Long Coordinates

I've constructed a database of nearly 200 locations using 'approximated' coordinates. The program is actually quite powerful and uses several Excel functions to convert the coordinates into an 'as the crow flies' distance by using the Great Circle formula.

So, it's been a painstaking process just to dig out the formula in order to show you 'how easy' it is to use.
    A                                    C                    D                       E                     F

 
1From:

Lat 1(deg)

Long 1(deg)

Lat 1(rad)

Long 1(rad)

2Ashland KY

38.475

-82.658

0.6715

-1.4427

4To:

Lat 2(deg)

Long 2(deg)

Lat 2(rad)

Long 2(rad)

5Louisville(SDF)

38.192

-85.731

0.6666

-1.4963

7Distanc(Miles)

167.62

This is just a generic presentation of the Great Circle formula using Excel. The coordinates above may not be 'official', but close enough.

Since the formula uses radians, we first have to convert the 'degrees' coordinates into radians. Quite easy to convert that. In cells E2, E5, F2, and F5, just multiply by Pi and divide by 180. Here's what that looks like...
From cell E2, the conversion formula says:
=C2*PI()/180

In cell A8, the Great Circle formula is as follows...
=6367*ACOS((SIN(E2)*SIN(E5))+(COS(E2)*COS(E5))*(COS(F2-F5)))/1.609

I've seen other versions of the Great Circle formula but prefer to use this one. I've noticed that this formula approximates the distance more accurately when compared to Atlas programs and the NWS coordinates for specified locations.

My program actually uses additional Excel functions that incorporate MATCH, INDEX, LOOKUP, and nested IF statements. Therefore, I have what I call a practical storm-intercept tool to help me track storms and, using roadway maps, attempt to intercept the storm.

Here is the one line from my program where the Great Circle formula was buried...man, that was tough to do.

=6367*ACOS((SIN(VLOOKUP($B$6,'LAT_LONG Table'!$A$2:$F$199,5,FALSE))*SIN(VLOOKUP($D$6,'LAT_LONG Table'!$A$2:$F$199,5,FALSE))+COS(VLOOKUP('DISTANCE Table'!$B$6,'LAT_LONG Table'!$A$2:$F$199,5,FALSE))*COS(VLOOKUP('DISTANCE Table'!$D$6,'LAT_LONG Table'!$A$2:$F$199,5,FALSE))*COS((VLOOKUP($B$6,'LAT_LONG Table'!$A$2:$F$199,6,FALSE))-VLOOKUP('DISTANCE Table'!$D$6,'LAT_LONG Table'!$A$2:$F$199,6,FALSE))))/1.609

MS

Tuesday, July 26, 2011

Upcoming Science Calculation...Great Circle Formula w/ Lat and Long. for Excel

Well, I'm working on my next little project...trying to uncover the formulas buried deep within my StormChase database. There's absolutely no way I would be able to present the entire program on my blog.
I just want to share how easy it is to use the Great Circle formula to help determine distance 'as the crow flies' from one location to another.

As I've said in a prior post, I use this as a storm-intercept application combining roadway maps and lat/long coordinates. Therefore, if a storm appears to take a different path than I expected or if there is a sudden transfer of energy along a squall line to a different location, then the coordinates of other nearby locations are already calculated so that I can use my roadway map to get me there in a timeframe that I can work with.

More coming soon...

MS

Monday, July 25, 2011

Astronomical Info...

Number of spotless days on the Sun (no sunspots) for 2011 - 1
That's pretty impressive compared to some of the previous years.

Here is the latest visible International Space Station times for Louisville...
July 26 5:48am - 5:51am; look west-southwest
July 27 4:52am - 4:55am; look south-southeast
July 28 5:29am - 5:31am; look west

Perseids Meteor Shower will peak on August 12-13. Unfortunately, full moon will obscure most but the brightest meteors. However, one can begin looking for these meteors well in advance of the peak night. Try looking around the first of August.

As a side point, if you love meteor showers like me, then 2011's shows will all be impacted by the moon's glare to some extent...that's right, all the way thru the rest of the year.

MS

Looking At the Global Heat

I provided this map of what is called 'Blocking Patterns'. Any Blocks can lead to repetitive weather conditions that can seriously affect residents' health especially during the winter and summer months.


Measured at the 500mb levels in the atmosphere, we can tell where some of the stronger blocks are by looking at the dark blues and red/oranges.

Something else we look at this time of year are the numbers. Anytime you see the "5940's", this is an indication of very hot conditions. Looking at the map above, locate the 2 areas of "5940" readings.

One extends across the southern and eastern U.S. The other extends across parts of north Africa and areas near the Middle East. Interestingly, some of the hottest readings ever recorded on earth have come from these locations of north Africa and the Middle East.

Disputed readings over 130 degrees have been measured in Algeria, Tunisia, and Mali. However, the hottest temperature ever recorded and accepted occurred at El-Azizia Libya at 136.4 degrees.

As of this report, here are some current readings...
Aswan Egypt - 111 degrees
Ahwaz Iran - 118 degrees (was 120 a couple of hours ago)
Abadan Iran - 116 degrees

Some forecasts for today...
Nasiriya Iraq - 120 high/93 low
Ahwaz Iran (7/26) - 122 high/102 low
Haima Oman - 115 high/84 low

MS

Sunday, July 24, 2011

Check Out Your County Fair for 2011

It's that time of year...fair time. Some county fairs have already taken place. Here are a list of some upcoming county fairs you may be interested in. Go out and have a good time and support your county fair.

Here in Kentucky...

LaRue County Fair
July 22-30
Hodgenville KY
Check out their home page and schedule here.

Southern Kentucky Fair
July 23-30
Bowling Green KY
Schedule here.

Mercer County Fair & Horse Show
July 25-30
Harrodsburg KY
See their schedule here.

Boyd County Fair
July 26-30
Ashland KY
Schedule of events found here.

Hopkins County Fair
July 26-30
Madisonville KY
Click here.

Kentucky Music Weekend
July 29-31
Louisville KY
See their itinerary here.

Also in Indiana....

Harrison County Agriculture & 4-H Fair
July 24-30
Corydon IN


Jackson County Agricultural Fair and 4-H Exhibition
July 24-30
Brownstown IN
Click here.

Monroe County Fair
July 23-30
Bloomington IN
Click here.

Friday, July 22, 2011

Louisville's Heat So Far This Summer

Today is July 22. We've had 15 days now in the month of July with temperatures at or above 90 degrees. For the year, including April and May, we have now reached the 90 degree mark 28 days.

Prior to today, the month of July was averaging 82.0 degrees (includes high and low temperatures), good enought for tying 7th all-time hottest July ever. However, the dewpoint, to my knowledge, has not breached the 80 degree mark for as many hours as it has this year compared to prior years (so far, I've calculated 19 hours of at least 80 degree dewpoint this month).

Remember last summer? The month of June 2010 was the hottest ever, July was the 3rd hottest, and August was the 3rd hottest. 2010 was also the hottest summer on record (Jun-Aug) including an astounding 85 days at or above 90 degrees for the calendar year.

MS

Thursday, July 21, 2011

Summertime? In the City...Seattle's '78 Minutes of Summer'

I found this interesting read about Seattle's cooler than normal summer. They've only reached the 80 degree mark for parts of two days so far this summer.

I guess you have to have a sense of humor when the weather's like this. What I wouldn't do to trade places with them for perhaps just a week.

Here is the article from the Seattle Times...

MS

Wednesday, July 20, 2011

High Dewpoints AGAIN

5:00pmUPDATE
Getting hammered in Valley Station! Lots of lightning, heavy rain, and strong winds. Just when I think the storm is moving on, we get hit from another direction. I've had winds from the northeast, east, southeast, and now west at times gusting over 40mph. Lots of little limbs down in the neighborhood. But I cannot get out in this because it's too dangerous. Too much lightning. I'll be trying to access LGE power outage page soon. My internet went out when I was trying to type this 15 minutes ago.
---------------------------
3:40pm UPDATE
CAPE vals near 6000! That's some high-quality instability. LI's in the vicinity of -8 to -9. Precipitable Water (PWATs) at 2.2.
That's one reason why storms are firing in the Louisville area. Just heard thunder at my location. The atmosphere is ripe for action! At 3pm, the highest temps in the state are at Bowling Green (96) and Covington (95).

Highest dewpoint readings: Ft Knox (82), Owensboro (81), and Louisville (80).

Highest Heat Indices: Ft Knox (116), Owensboro (115), and Louisville (112)
---------------------------------------------------
During the 1:00pm update, Louisville's dewpoint is at 80 degrees...oppressively oppressive. Heat index is at 111. My dewpoint reading here at my location is 81. So far, the highest heat index I found was at Ft Knox at 116.

Here is a contour map of the most recent dewpoints...

Our regional dewpoints are among the highest in the country...
MS


Tuesday, July 19, 2011

A 'Juiced' Atmosphere

5:30 pm UPDATE
Storms have developed east of the Metro Louisville area near Frankfort. Some have reached severe criteria (radar-indicated). I'm now beginning to see the storms I mentioned earlier developing to our north and northwest. These will have a chance to affect parts of Indiana and possibly some counties within the LMK county warning area.
--------------------------------
Wow, have you seen the recent CAPE values and Lifted Indices? Approaching 4500 and -9 respectively. This is one unstable airmass. However, there must be some capping in the upper levels, thanks to an expanding ridge of High pressure.

But I do see some signs of weakness in the cap, perhaps to our north.  I think the best chance for storms will exist across Indiana, perhaps even reaching southern Indiana thru early evening.

There is a slight chance for storms to reach Louisville, if these can develop. Depends on the fluctuating ridge that continues to build into the area. Any storms that do develop will produce extremely heavy rainfall, intense lightning, and some isolated, damaging microburst winds.

Most of the activity that does develop will fade away after sunset.

MS

Do You Like Science? Heat Index Calculation

           A
1   Temperature
      C
Humidity
       F
Heat Index
2          81
82
86.82

This is an Excel spreadsheet program. Fairly simple. Just enter the temperature and humidity as seen above.
However, the formula behind the Heat Index is a bit more complex. I will show you the formula for the Heat Index that is in cell F2.

=-42.379+2.04901523*A2+10.14333127*C2-0.22475541*A2*C2-6.83783*10^-3*A2^2-5.481717*10^-2*C2^2+1.22874*10^-3*A2^2*C2+8.5282*10^-4*A2*C2^2-1.99*10^-6*A2^2*C2^2

I shared the dewpoint calculation last week. The above formula for the Heat Index is fairly accurate. It has an error of +/- 1.3 degrees. Nevertheless, I use it for a close approximation for my purposes.

I hope to share additional formulas for you in the near future like Wind Chill index and distances between locations using coordinates. The latter I like to use for my StormChase database since storms typically don't follow any roadmap. I use it more for an intercept application combining road maps and coordinate distances.

MS

Monday, July 18, 2011

On This Day...

On this day in 1942, one of my favorite rainfall statistics occurred in Smethport, Pennsylvania. A 3-hour rainfall record was set when 28.5" fell during that period.

In addition, the 4.5-hour rainfall record was set as 30.7" fell and the 12-hour record of 34.3"!

These are not only U.S. records, but the 3-hour and 4.5-hour totals constitute world records.

MS

Sunday, July 17, 2011

Tropical Storm Bret

Our second named tropical system has arrived near the Bahamas.
Looks like not much impact for the U.S. mainland except for choppy waves . The system is forecast to stay offshore, steering to the northeast rather quickly.
[Image of 5-day forecast and coastal areas under a warning or a watch]


MS

Friday, July 15, 2011

New Kentucky High Temperature Record???

Here you go...it's official. A new high temperature record for Kentucky has been set. Looks like Booneville in Owsley county at 116 degrees!


Well, ok...something's wrong with this picture. Hmm, mid and upper 70's surrounding a 116 degree reading. Wait a minute!! Somebody's trying to cheat here. 'No record for you!'


Of course, a heat burst could have occurred since there were thunderstorms in the vicinity, but I seriously doubt the reading.
MS

Thursday, July 14, 2011

Tick Season Is Here...Babesiosis

I know friends who are planning their annual hiking/camping trip. Nothing can be as invigorating and peaceful (at the same time) as such a trip.

However, one of the downsides that can undermine the trip is the prevalence of ticks, or most disconcerting, deer ticks. These are the little guys that carry a particular bacteria known to cause Lyme disease, an inflammatory disease caused by the tick bite.

In addition, here is a video of a blood disease I don't recall hearing or reading about lately. Since I hate ticks, I'm surprised I haven't heard of this sooner. It's called Babesiosis.

For more information about Lyme disease, click this link.

Other useful information, including how to avoid tick bites can be found here.

MS

Wednesday, July 13, 2011

Rare Snow In the Driest Place on Earth

Arica, Chile and surrounding areas of the Atacama desert are among the driest places on Earth. Check out the freak snow event that hit the desert this past week by clicking here.

Also, I provided a video footage from the BBC on this snowstorm. This is the link.

MS

Impressive Rain Totals July 12 2011

Although rain totals in Jefferson county were not too bad, relatively speaking, some areas as close as the Bullitt/Jefferson county line saw substantial amounts of rain. Check out this partial map from our friends at CoCoRaHS as of this morning...

I live in the southwest part of Jefferson county. My total was 1.12". Look what happened about 15 minutes east of my location...4.3".

MS

Tuesday, July 12, 2011

Do You Like Science? Dewpoint Calculation

This post is really designed for those who are interested behind the numbers of such things as dewpoint, earthquake/seismic calculations, and distances between cities.

I don't mean to 'wow' non-users of these calculations, but some of these formulae are quite lengthy.

I've worked with the calculations on my own and developed my own programs for their use.

For example, dewpoint has been a 'hot' issue lately. So many people are confused about the difference between humidity and dewpoint. Someone explained it to me this way:
Often when one hears the term humidity, it's referring to the relative humidity, expressed as a percentage. However, dewpoint has been described as the absolute humidity, a more accurate way of describing the amount of moisture in the air and is closely associated with temperature (as the following calculations will show).

Here are the factors at play in the dewpoint calculation...
Temperature expressed in Fahrenheit
Relative humidity expressed as a percentage

The dewpoint formula is based on temps expressed in Celsius; therefore the conversion from F to C is
5/9*(Temp F-32)

For every temperature expressed in Celsius is a corresponding saturation vapor pressure for that particular temperature. For example, at 10 degrees C, the saturation vapor pressure is 12.27. Also, at 20 degrees C, the saturation vapor pressure is 23.34. Here is that calculation...
Saturation Vapor Pressure = 6.11*10^(7.5*Temp C/(237.7+Temp C))

The actual vapor pressure is what will be used in determining the dewpoint. In order to do this, we must convert the saturation vapor pressure to the actual vapor pressure by the following calculation...
Actual Vapor Pressure = Relative Humidity * Saturation Vapor Pressure/100; the relative humidity is expressed as a whole number percentage...i.e...30 percent, not 0.30.

After all of these conversions, we are now ready for the dewpoint calculation. But, remember, this will be expressed in degrees Celsius. We'll convert into degrees Fahrenheit afterward.

Dewpoint = (-430.22+237.7*LN(Actual Vapor Pressure))/(-LN(Actual Vapor Pressure)+19.08)
The LN abbreviation is the natural log function.

Convert degrees C to F:
(9/5)*Dewpoint C+32

Let's use an example...
Temperature is 90 degrees F
Relative humidity is 52%
Convert F to C: 90 deg F = 32.22 degrees C
Saturation Vapor Pressure for 32.22 degrees C = 48.01
Actual Vapor Pressure (at 52%) = 24.97
Dewpoint = 21.09 degrees C
Dewpoint = 69.97 degrees F or 70 (rounded)

I will use other calculations in another post. Next, will be the heat index calculation.

Glossary
Saturation Vapor Pressure - The vapor pressure of a system, at a given temperature, wherein the vapor of a substance is in equilibrium with a plane surface of that substance's pure liquid or solid phase.

{Actual} Vapor Pressure - The partial pressure of water vapor in an air-water system.

Relative Humidity - A dimensionless ratio, expressed in percent, of the amount of atmospheric moisture present relative to the amount that would be present if the air were saturated. Since the latter amount is dependent on temperature, relative humidity is a function of both moisture content and temperature. As such, relative humidity by itself does not directly indicate the actual amount of atmospheric moisture present. See dew point.

Dewpoint - (Abbrev. DWPT) - A measure of atmospheric moisture. It is the temperature to which air must be cooled in order to reach saturation (assuming air pressure and moisture content are constant). A higher dew point indicates more moisture present in the air. It is sometimes referred to as Dew Point Temperature, and sometimes written as one word (Dewpoint).

MS

Monday, July 11, 2011

Severe Storms Across Chicago; Approaches Kalamazoo MI

5:00pm UPDATE
1 death was confirmed from today's severe complex of storms. It was in Cutlerville MI. Here are some video footages of the storm's aftermath.
Click here

Meanwhile, our heat indices have reached the mid 110's this afternoon. 80+ dewpoint readings quite common, including my location at 4:15pm.
----------------------------------------------------------
12:00pm UPDATE
Hope College_20110711115533_JPG
Since there is so much storm damage in the Michigan area, I just copied this from Bill Steffen's weather blog.

STAY AWAY FROM DOWNED POWER LINES AND STAY OUT OF LAKE MICHIGAN!  ONE FATALITY IN CUTLERVILLE, 38-year old man ON 68 ST. EAST OF DIVISION – TREE ON A HOUSE WITH PARTIAL BUILDING COLLAPSE.  The man was outside.  15-20 places with wires down in Kentwood alone.  Damage assessment team heading to Kentwood.    Gust to at least 55 mph at the Ford Airport.  MAJOR THREAT FOR DAMAGING WINDS CONTINUES SOUTH OF A LINE FROM THE LANSING AREA TO PORT HURON SOUTH TO FORT WAYNE AREA TO FINDLAY, OHIO.  Estimated sustained winds of 70 mph in the Hope College area of Holland, according to former Mayor McGeehan.  Windows blown out in Holland with numerous trees uprooted.    Roof blown off commercial building in Berrien Co.  Benton Township – tree on a house.   Major wind Damage at Hope College.  Wires down 5812 S. Division with smoke in a building.  Wires down at Kalamazoo and 32nd. Wind damage in Cutlerville. Strongest winds moving through the Lansing and Jackson areas at 11:30 PM.  Over 600,000 customers without power in the Chicago area. EF-1 DAMAGE reported in the Chicago area.  Trees, wires down in Sturgis, Colon, Constantine, Portage, Vicksburg and Three Rivers.  US 131 closed near Schoolcraft…trees across the road.  Closings:  M216 Marcellus and M-60 near Three Rivers.
-------------------
11:40am UPDATE
Serious damage in western Michigan. Looks like Holland and Cutlerville reporting most of the damage so far. At least 1 fatality reported in Cutlerville. Many trees down across these areas including trees on homes. Obviously, many power outages. Updates soon.
-------------------------------
10:35am UPDATE
At least 80,000 ComEd customers without power in the Chicago vicinity. Probably more by now. Some train lines were temporarily suspended. Reports of at least one tree across tracks. Lots of trees down in the suburbs. Looks like another busy day for cleanup crews for their area.
-------------------------------
I'm following a bowing line of intense thunderstorms this morning. I watched LIVE streaming video at Wrigley Field and wasn't too impressed. However, O'Hare airport recorded a 63 mph gust and Midway airport a 75 mph gust.

If the line holds together, it will approach Kalamazoo MI in about an hour from now (9:45am edt). I will post updated power outages in Chicago and follow the action on police scanners for Kalamazoo, if the situation warrants.

MS

Sunday, July 10, 2011

Beat the Heat...Ice Cream for a Treat

Despite the atrocious heat, I can't think of too many ways to cool off other than to celebrate Ice Cream month. Although I can't find any 'free' deals for this upcoming Sunday, July 17, National Ice Cream Day, there are still several brands/chains giving some attention to it.

Here's Turkey Hill's Web site along with some fun facts:
I like this one from Fact #66 about what happens when you eat your ice cream a little too fast...
Find out more here.
Keep checking back at their site for more ice cream facts each day of Ice Cream month. Leave a comment there and you could win some free ice cream from Turkey Hill.

Otherwise, hopefully some storms will halt the heat or at least keep the bulk of the heat confined to the western parts of the state during the next couple of days.

MS

M

Thursday, July 7, 2011

That's Stats

Happy Chocolate Day and National Strawberry Sundae Day!

Today is Day 188. We are in the middle of Week 27.

The weather has been a bit repetitive; therefore, I've selected a few stats to kind of update us on how we've been doing so far this spring/summer...

90 Degree Days:
Louisville (SDF) - 16
Louisville (WFO) - 13
Bowling Green - 18
Lexington - 7

Days of Measurable Precipitation (since January 1)
Louisville (SDF) - 77
Louisville (WFO) - 79
Bowling Green - 78
Lexington - 85

Other locations outside of Kentucky with measurable precipitation of at least 0.01" include:
Seattle has recorded 106 days
Forks WA has recorded 142 days, or every 3 days out of 4.

Days of Measurable Precipitation >2.00"(since January 1)
Louisville (SDF) - 6
Louisville (WFO) - 5
Bowling Green - 4
Lexington - 1

Here's an interesting stat. Annual snowfall amounts are calculated and tallied ending June 30 of each year. Therefore, as of July 1 2011, our snowfall amounts have been reset to zero. Unfortunately, snow is not in the forecast; however, this is how we did last year (July 1 2010 - June 30 2011)...

Days of Measurable Snowfall (again, from July 1 2010 - June 30 2011)
Louisville (SDF) - 20
Louisvlle (WFO) - 21
Bowling Green - 15
Lexington - 23

Total Snowfall Amounts For the Period (July 1 2010 - June 30 2011)
Louisville (SDF) - 17.7"
Louisville (WFO) - 19.5"
Bowling Green - 21.2"
Lexington - 27.8"

MS

Tuesday, July 5, 2011

July's "Other" Holidays...

Here is a breakdown of this week's 'holidays'. Obviously, yesterday was the 4th so we won't include that one.

First, let's mention that July is National Hot Dog Month and National Ice Cream Month (although I believe every month is Ice Cream Month in my household).

Therefore, congrats to Joey Chestnut, now a 5-time winner of Nathan's Hot Dog Eating Contest at Coney Island.

July 5 - Work-a-holics Day (if you live and breathe that stuff one calls work, you need a day off)
July 6 - National Fried Chicken Day (now that's what I'm talkin about)
July 7 - Chocolate Day (would be a nice day to visit Hershey PA)
July 7 - National Strawberry Sundae Day (after/before your chocolate experience?)
July 8 - Video Games Day (if this isn't great enough, there's a National Video Games Day on Sept 12th; Whoa!)
July 9 - National Sugar Cookie Day (you know, I do have a dentist's appointment later this month)

Have a nice week!
MS

Latest Sunsets in U.S. Eastern Time Zone...

Recently, I noticed that our days have now begun to shorten. However, our sunset here in Louisville still remains at 9:10pm edt. Starting this Thursday, sunset will be at 9:09 and it's all downhill from there.

Have you wondered what the latest sunset is in the Eastern Time zone?

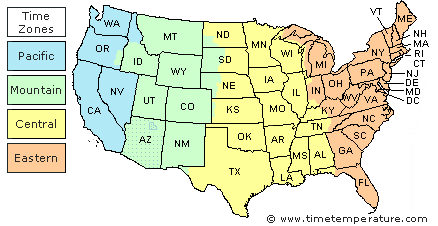
First, here is a map...

Michigan time zone map

On the map above, notice that the U.P. of Michigan resides in the westernmost part of the Eastern Time zone. In addition, it is located pretty far north. So I tried to locate the most western AND northern points of the Eastern Time zone and came up with these results...

Isle Royale National Park MI - 10:00pm
Ontonagon MI - 9:56pm

This time, click on the map above. Notice Ontonagon, then locate Ironwood to the southwest. Ironwood resides in the Central Time zone. Isle Royale National Park is a small island located about 48 miles northwest of the U.P. mainland. It has to be one of the farthest northwestern points within the Eastern Time zone.

Here are some honorable mentions for sunset times within the Eastern Time zone...
Calumet MI - 9:54pm
Houghton MI - 9:54pm
Marquette MI - 9:47pm

MS

Sunday, July 3, 2011

Will Storms to Our West Affect Outdoor Events?

Storms across the St Louis region are packing a lot of fireworks of their own. Sporadic reports of  tree and powerline damage coming in across police scanners.

It appears from RADAR imagery that storms are firing along a boundary oriented from west to east. The storms are making some eastward progression while additional cells are developing along the unstable boundary line.

While the most likely scenario seems to favor a lesser chance for storms here, at least this evening, I would not be surprised by some formation of isolated storms in the area. Just keep an eye to the sky. Best chances for storms are across the western part of the states of Indiana and Kentucky.

MS

Friday, July 1, 2011

Golf and Baseball in the Windy City...

Ok, we're not actually talking sporting events here in Chicago, but the conversation piece they'll be talking about for a while was the storms that blew through parts of Wisconsin and northern Illinois, including the Chicago area.

Lots of damage reported in Kenosha Wisconsin along with injuries and even a fatality. Some wind gusts over Lake Michigan were reported over 90 mph. Add to that, golf-ball size hail pelted downtown structures in Chicago with some reports of baseball-size hail in the region.

Here's the official story...Click here.

MS

Tornadoes on Easter Sunday

This is a worse case scenario. Tornadoes and flooded, blocked roadways making for great difficulties reaching residences affecting hard hit ...