The snow addict in me is telling me that this could be our first snow of the season of any significance. The latest NAM offered some hope for a burst of snow coming in here behind some really cold air.
One of the analog years that came up is one that I featured in my winter forecast, winter of 2000/01. The analog I saw corresponded with a Jan 2001 setup that put down widespread 2-4" amounts for central and east Kentucky. Some locations had well over 4" during the week.
Although it's still premature to say this is a definite snow setup, I'm getting excited. As I said in a past post, the Dec 7-9 time frame bore watching.
Let's see what the next couple of runs suggest. Pay attention to the NAM. If this is a true snow setup, the NAM will offer the best solution in time.
MS
Monday, December 5, 2011
Sunday, December 4, 2011
Weather Terminology Unmasked
At the NWS office in Louisville, I noticed their overnight Area Forecast Discussion included the term, isentropic lift. Often, I see this term used in their discussions. While I had no idea about an exact definition of the term, isentropic, I knew it was related to precipitation.
First, here's a brief excerpt from the discussion I'm talking about...
"As a weak shortwave ejects from the longwave western trough late
tonight, increasing isentropic lift associated with the rightentrance region of a strengthening jet will bring in a second round
of widespread rain which will overspread our entire forecast area by
the dawn Monday morning."
Thankfully, the NWS provides a glossary for these terms that are underlined. In fact, by clicking on the term, isentropic lift, here is the official definition...
"Lifting of air that is traveling along an upward-sloping isentropic surface.
Isentropic lift often is referred to erroneously as overrunning, but more accurately describes the physical process by which the lifting occurs. Situations involving isentropic lift often are characterized by widespread stratiform clouds and precipitation, but may include elevated convection in the form of embedded thunderstorms."
That's a nice way to explain away the process in general terms. However, isentropic??? Me and my inquiring mind needed to know.
The word itself, isentropic, needed a little bit more explanation. Well, if the term would have been called isoentropic (iso+entropic), I could have figured out a partial explanation. Just as isobars mean lines of equal barometric pressure, isoentropic would mean equal entropy.
And what is entropy? A quantitative measure of disorder, chaos, in a system or process. Sounds a lot like our weather. It's a significant player in the law of thermodynamics that involves heat transfer.
Well, I found an excellent read about the isentropic lifting process HERE.
Here is a partial explanation from the site I just linked you guys to...
"NWS refer to isentropic lift or isentropic upglide simply as the word, "overrunning" in that it is an event defined as relatively warmer, moister air that rides up and over a thin, relatively cooler, drier shallow layer at the surface over a particular region. Such air that is forced to rise upwards when it is moist or when it becomes moist, forces the air to cool and condense into clouds and then water droplets which finally fall as rain, if the isentropic lift is strong enough to bring this about."
However, he describes the process nicely afterward. Give it a read. You might learn something.
MS
Saturday, December 3, 2011
Flood Potential UPDATE
Well, the late evening HPC numbers are in, a little less QPF than previous runs. However, with a solid 2-4" expected statewide, Flood WATCHES are up for much of central and west Kentucky.
The 12zGEM and 18zGFS have pretty much flip-flopped on rain totals since yesterday. Now, the GEM is calling for about 2.07", while the GFS is calling for 1.87" for the period here in Louisville.
Nevertheless, rain totals that approach 2" will cause river levels to rise, possibly nearing flood stage along the Ohio river gauges. If more than 2" occurs, expect minor to moderate flooding throughout the region, including tributaries that flow into the Ohio river.
Personally, I'm expecting about 2.5", good enough to make this the wettest year on record. Even 2" will do it. Man, what a year!
MS
Friday, December 2, 2011
Flooding - A Possibility Next Week
The HPC is going gangbusters here on this early Friday afternoon regarding expected precipitation amounts for next week. 5-day QPF amounts of 3-5" for much of the state is forecast. Sounds a little excessive, but the amounts have trended higher over the past couple of runs. In fact, some in the range of 5-6" downstate could be realized.
The 12zGFS is still showing over 2" for Louisville and the 12zGEM about 1.75". I don't quite have the numbers for the NAM yet, but I don't rely on this model very much for rainfall amounts.
Nevertheless, most models are pointing toward another heavy rain maker, which should lead to river rises that may involve minor to moderate flooding in parts of the state by mid to late next week.
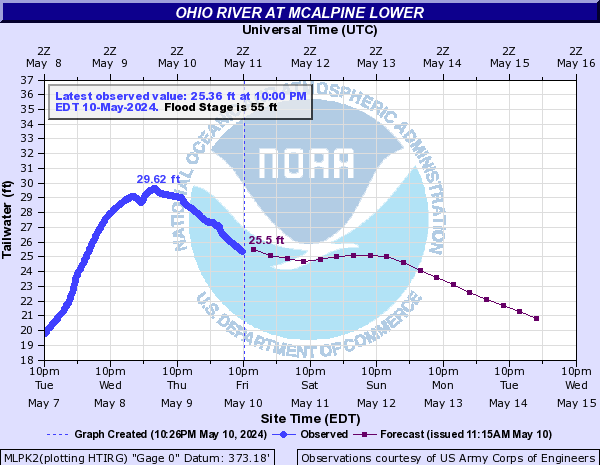
According to the Advanced Hydrologic Prediction Service, the Ohio River LG is forecast to fall slowly to around 40 feet by Monday. With expected heavy rains not yet factored in, expect rapid river rise that looks to exceed flood stage of 55 feet if more than 2" should occur.
The Ohio River UG, where downtown Louisville is located, should fall slowly to a little over 17 feet by Monday. Again, expect the river to rise throughout the week, possibly exceeding flood stage of 23 feet next week if the heavy rains verify.
Stay tuned...
MS
The 12zGFS is still showing over 2" for Louisville and the 12zGEM about 1.75". I don't quite have the numbers for the NAM yet, but I don't rely on this model very much for rainfall amounts.
Nevertheless, most models are pointing toward another heavy rain maker, which should lead to river rises that may involve minor to moderate flooding in parts of the state by mid to late next week.
According to the Advanced Hydrologic Prediction Service, the Ohio River LG is forecast to fall slowly to around 40 feet by Monday. With expected heavy rains not yet factored in, expect rapid river rise that looks to exceed flood stage of 55 feet if more than 2" should occur.
The Ohio River UG, where downtown Louisville is located, should fall slowly to a little over 17 feet by Monday. Again, expect the river to rise throughout the week, possibly exceeding flood stage of 23 feet next week if the heavy rains verify.
Stay tuned...
MS
My Forecast Snow Amounts For This Winter 2011/2012
In my winter forecast for 2011/12, I did not include my thoughts about how much snow will fall at any one location for the upcoming winter because, realistically, one cannot know this. There are just too many 'what-ifs' to figure out, and the storm tracks are extremely pivotal in determining who gets a lot and who gets a little or nothing.
But, I have been working on a probability table for some locations with an estimate of how much snow could accumulate for this winter at random locations. Due to timing differences, the snowfall estimates may run over into March.
Louisville:
The heat island effect may play a minor part in our snow amounts at the 'official' location. In my winter forecast, I have Louisville on the edge of heavy snow accumulations. However, I'm still expecting above normal snowfal. I'd rather see snow amounts measured at the National Weather Service on Theiler Lane, away from all of the concrete, though
However, we will stick with the airport readings for this forecast. In order not to bore you with my methodology, I will present only a partial table of probable snow amounts compared to normal.
Dec-Feb Average Snow Amounts = 10.8" (based on 1981-2010 norms)
Probability scale of 1-10 and suggested snow amounts
3 - 14"
4 - 15-16"
5 - 17"
6 - 18-19"
7 - 20-21"
8 - 22-24"
7 - 25-26"
6 - 27"
5 - 28"
Therefore, for Louisville, the highest probabilities of 7 and 8 out of 10 suggest snow amounts in a range of 20-26", probably closer to 22".
----------------------------------------
Lexington:
In my winter forecast, I have Lexington in an area where heavy snow could certainly accumulate. Even if this should not verify, I'm still expecting above normal snowfall.
Dec-Feb Average Snow Amounts = 11.0"
Probability Scale of 1-10 and suggested snow amounts:
4 - 14"
5 - 15-16"
6 - 17-19"
7 - 20-23"
8 - 24-27"
7 - 28-29"
6 - 30"
As you can tell, there is a wide spread in probable amounts, anywhere from 20-29". I think Lexington will be in the middle of that range, 26-27".
In a future post, I'll try and include a couple of other locations. Nevertheless, expect higher snowfall amounts as one travels from west to east across the state.
You can access my thoughts about the upcoming winter on this blog in the Miks Piks section.
MS
How About One More Winter Forecast for Kentucky
This one is from one of my favorite meteorologists in the Louisville area. A multi-year Best of Louisville award winner and everyone's go-to winter weather enthusiast, John Belski.
Click Belski's Winter Forecast 2011/2012
Briefly, he is forecasting 20-25 inches of the white stuff, just slightly below my expectations for the coming winter.
Although I don't believe in forecasting snow amounts so far out, I will be posting the highest probabilities with an estimate of what could accumulate during the Dec-Feb time frame for selected locations.
MS
Thursday, December 1, 2011
Snapshot of December
Average highs really take on a wintertime look.
For Louisville...
Dec 1 - Avg High = 51; Avg Low = 34
Dec 31 - Avg High = 43; Avg Low = 27
From the Climate Prediction Center...
Temperatures:
 Precipitation:

For Louisville...
Dec 1 - Avg High = 51; Avg Low = 34
Dec 31 - Avg High = 43; Avg Low = 27
From the Climate Prediction Center...
Temperatures:
According to the CPC, they are forecasting that the period from December 6-10 will average near normal for temperatures while precipitation is forecast to be above normal.
In addition, for the period from the 8th thru the 14th, above normal temperatures and precipitation are expected.
It could be possible that the CPC is forecasting this scenario based on recent, ongoing teleconnection signals involving the NAO/AO, whose values are expected to be neutral to positive over the coming several days, while the PNA is expected to be negative.
This has been a concern to me, as I noted this trend a few days ago. Serious cold air will be lurking not too far away from our region for the next couple of weeks. In fact, during the first week of December, we should get a taste of what a Polar Pop is like. However, after this period, temperatures are expected to be milder, either supporting all liquid or possible icing, if we get into a shallow layer of Arctic air near the surface while 850mb temperatures may be warm enough to support rain. This would be during the 7-9 period, primarily. Something to keep an eye on.
Personally, I'd rather have the snow. Things always change. Let's hope so.
MS
Subscribe to:
Posts (Atom)
-
Recently, I noticed that our days have now begun to shorten. However, our sunset here in Louisville still remains at 9:10pm edt. Starting th...
-
 In July of this year, I did a segment about the latest sunsets in the eastern time zone. This corresponded nicely with the summer solstice a...
 -
A 1 Temperature C Humidity F Heat Index 2 81 82 86.82 This is an Excel spreadsheet program. Fairly ...
