Sunday, October 16, 2011

Keeping An Eye On the Arctic

Within the past couple of days, I've noticed a significant buildup of cold air near the Arctic circle. At one point, I saw a reading of -20 degrees F this morning.

Click map below for a current view of the Arctic chill...


Just a short time ago last week, the temperatures were already falling; however, at least temperatures were near 10 degrees. Therefore, a drop of nearly 30 degrees within the past few days is quite significant.

As daylight continues to fade near the Arctic circle, not much rebound in temperatures is expected. Look for signs of the cold air building south over time. Any number of strong low pressure systems could tap into the 'cold reserve' and sling it southward toward the U.S. border.

MS

Saturday, October 15, 2011

October - Known For Large Temperature Spreads

Typically, the month of October is drier than other months of the year, especially around our part of the country. Summer is quickly losing fast hold of its dominance as daylight shortens and nighttime lengthens.

Interestingly, a drier ground can still produce very warm temperatures during the shortening day. However, during the night, the same dryness allows all of that heat to escape back into space thus producing cold readings.

I would like you to check out this site below sometime. The table may not contain all of the U.S. reporting stations, but there is still a lot of useful data.

If you're somewhat knowledgeable of Microsoft's Excel spreadsheet, you can work with the data to find out the highest and lowest temperatures in the table and, one of my favorites, the temperature spread between the highest and lowest temperature of any one location. Of course, you would have to calculate that by inserting an additional column. Then use a VLOOKUP function to find the reporting station(s) that match(es) the largest spread in temperature.

For example, the high and low temperature at Hanksville UT on October 14 was 85 / 35. Therefore a 50-degree spread and one that proved to be the maximum spread of all locations listed in the table.

Here's the link to the table that I'm talking about...Click HERE.

Also, here's a sample of the table I'm talking about...

FILE FORMAT: FIRST RECORD IS DATE IN THE FORM YYYYMMDD. THE REMAINING RECORDS
CONTAIN MAXT(F),MINT(F),REPORTED AND ESTIMATED PRECIP IN HUNDRETHS OF INCHES,
9 WEATHER CHARACTERS,ID AND CITY NAMES WHERE AVAILABLE.
*****NOTE***************NOTE*********************NOTE********************
20111014
30 27 3 3 9SSSF/SRL70026 AK BARROW/W.POST W.ROGERS
39 32 0 0 9////////70104 AK CAPE_LISBURNE(AWOS)
39 35 0 0 9//RRR///70117 AK TIN_CITY_AFS_(AWOS)
36 33 23 23 9R///SSSS70133 AK KOTZEBUE/RALPH WIEN ME
34 29 0 0 9////////70173 AK INDIAN_MTN_AFS_AWOS
35 27 0 0 9SS////SS70174 AK BETTLES
36 32 0 0 9////////70178 AK TANANA/CALHOUN_MEM
36 21 0 0 9////////70194 AK FORT YUKON
44 33 0 0 9RR//////70200 AK NOME
43 36 0 0 9////////70204 AK GAMBELL_(AWOS)
43 34 0 0 9////////70207 AK UNALAKLEET
39 36 0 0 9//M/////70212 AK CAPE_ROMANZOFF_AWOS
41 38 55 55 9RRRRRR//70219 AK BETHEL
36 33 0 1 9RRSSSR/R70222 AK GALENA_AIRPORT
43 34 11 11 9/RRR/RR/70231 AK MCGRATH
48 36 0 0 9////////70232 AK ANIAK
49 40 0 0 9//RR////70235 AK SPARREVOHN_(AWOS)
37 27 0 0 9////////70246 AK MINCHUMINA
37 32 -999 1 9---SS/S-70249 AK PUNTILLA_(LAKE)
41 33 7 7 9R/SSR///70251 AK TALKEETNA
36 34 0 3 9---RRRR-70255 AK SKWENTNA
50 38 11 11 9/RRRR///70259 AK KENAI/MUNI
48 29 0 0 9////////70260 AK NENANA/MUNI
50 21 0 0 9////////70261 AK FAIRBANKS/INTL
49 20 0 0 9////////70265 AK EIELSON_AFB
46 24 1 1 9////////70267 AK BIG DELTA
44 20 1 1 9////////70271 AK GULKANA


The table looks intimidating, but the Excel spreadsheet really cleans it up nicely, making the data easy to work with.

MS

Friday, October 14, 2011

Working On the Winter Forecast 2011/2012 FINAL SEGMENT

Atmospheric patterns associated with El Nino and La Nina
Remember these maps above, especially the lower one. Then, I want you to compare all of the winter forecasts made so far with this lower map.

These are typical weather patterns during an El Nino/La Nina winter. But, when was the last time you recall that our weather has been typical? During the past year or so, the United States has endured some extreme weather. Destructive tornadoes, crippling snowstorms, roaring flash floods, extreme drought and heat, just to name a few, have all occurred in one calendar year. I do believe that La Nina conditions will continue to contribute to extreme weather, perhaps here in the United States again.

However, weather does not only happen here in the United States. As I always stress, weather is global. There's not some mysterious jet stream that only exists across the United States, but weather patterns exist all across the globe. How these patterns develop, change, and dissipate can have far-reaching effects.

I want to share a global map of a typical La Nina and its affects.

Cold Conditions
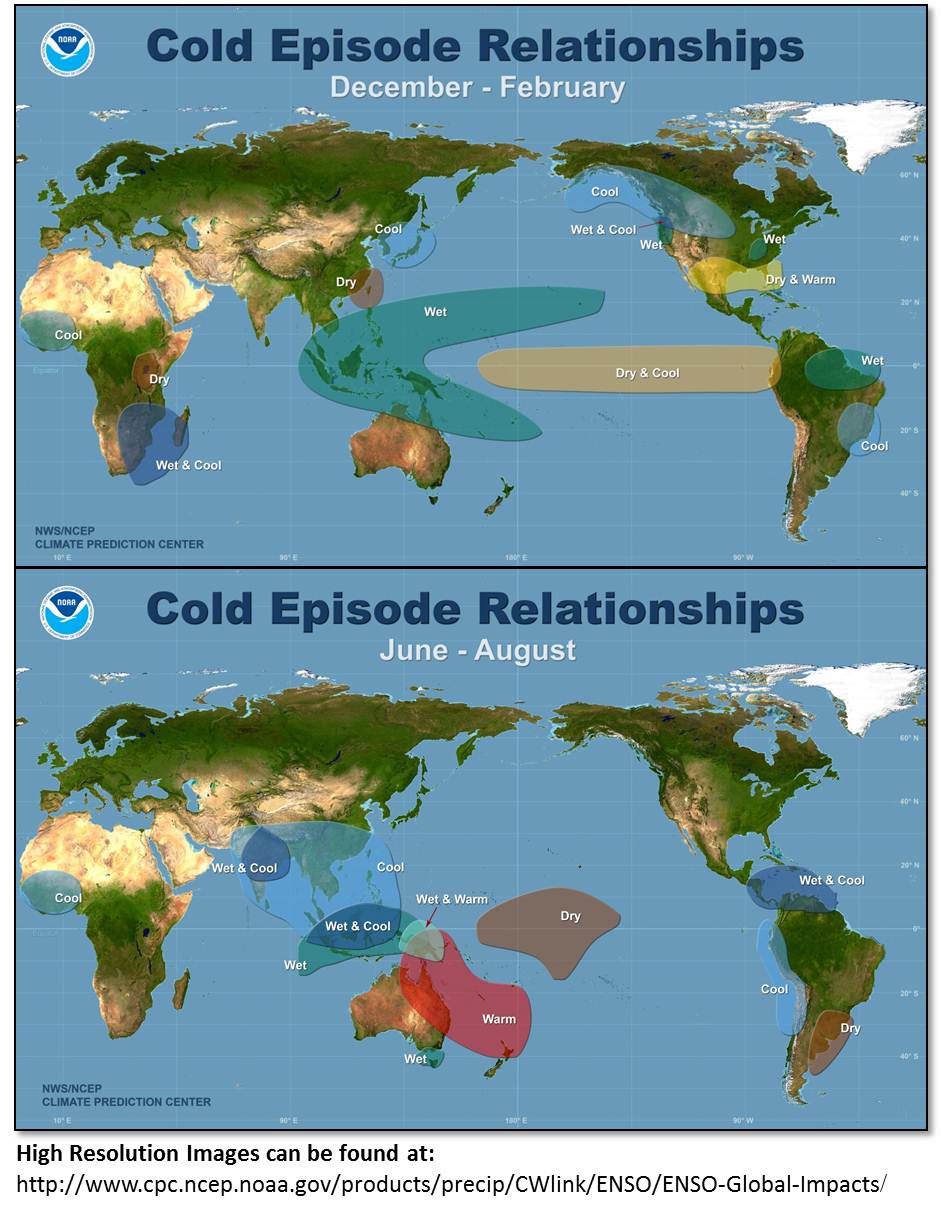
Just take note of the first map that corresponds to a La Nina winter episode.

Sorry about the map size, interfering with my other blog information on the right side. However, I felt this was an important map to demonstrate.

Looking at data for weather after October 15 2011 suggests to me that our upcoming winter may take on a shape similar to that of winter 2000/2001. A possible significant difference may be that La Nina II may be stronger than the previous one, according to recent reports.

As I will feature in my OFFICIAL Winter Weather Forecast 2011/2012, extreme weather looks to be likely across the globe. Some parts of the United States will see all-time records related to temperatures, snowfall, or rainfall during the upcoming winter of December, January, February, or for the 3-month period.

Which parts of the United States stand the best chance for such records?

Well, I have more data to digest before issuing my official thoughts. I will be considering preliminary data from other parts of the globe at the beginning of November. Then I should be ready for my official forecast.

Look for the MikJournal's Official Winter Weather Forecast 2011/2012 by the end of the first week of November 2011.

MS

Thursday, October 13, 2011

Mid-October Report

From my point of view, this has been one of the best stretches of Fall weather in a long time. Warm days and cool nights, clear skies, and dry weather. Everyone who had outdoor activities or chores offered no complaints that I'm aware of. I didn't complain.

Now, turning our attention to a significant pattern change, I'm becoming more convinced that the GFS wants to end the growing season by sometime next week (around Oct 19-20). This could introduce the first sign of how our upcoming winter may play out.

In my final segment on Working On the Winter Forecast 2011/2012, I will show one of the trends that I could be leaning toward, IF this indeed is that pattern change I've been waiting for in October.

At any rate, sometime next week, colder air will be pouring into the Ohio Valley with temperatures tumbling and possible talk about wind chill readings, yes, below freezing wind chill readings. In addition, if enough clearing and calm conditions set in, low temperatures in the city of Louisville could approach the low to mid 30's, meaning that the 'burbs could dip into the upper 20's to low 30's. A killing frost is possible. Stay tuned.

Another shot of cold air may invade the region the week before Halloween. However, I expect warmer conditions before the end of the month.

Looks like how our winter may unfold? Lots of ups and downs....

MS

Tuesday, October 11, 2011

CPC Changes Its Tune

On Monday, yes, just yesterday, I highlighted the CPC's 8-14 day outlook for Oct 18-24 and it was showing above normal readings for much of our region. Today, a much different picture. Since the GFS introduced the possibility of a significant cold spell for the first part of that period and continues to reemphasize that cold spell, today's 8-14 day outlook paints a much colder solution for the period.


Other teleconnections are supporting this forecast including the NAO, which is forecast to turn negative during this time.

Some of the data I've been looking at supports frozen precipitation as far south as Louisville. Could be wet snowflakes or sleet pellets; regardless, a possible introduction to winter already?

This might prove to be the Season-Altering Pattern Shift (SAPS) that I wanted to see happen during October for finalizing my winter forecast 2011/2012.

MS

Mount Washington Observatory Fall Foilage Picture

What a spectacular view...

Here at my location in Valley Station, some of our trees are already peaking.

MS

Texas - Scorched Land

Connecticut Map

Texas State

Since November 2010, over 5625 square miles of Texas land has burned. That equates to a size greater than the state of Connecticut.

Although this figure only represents about 2.1% of the Texas landscape, we can put that into greater perspective. Burned areas represent a drive from Waco to Austin along I-35. From Waco east to Fairfield at I-45. And from Austin northeast to Rockdale at intersection of US 77 and US 79. This is perhaps a little too conservative.

More fires continue despite some recent, beneficial rains in parts of the Lone Star state.

MS

Tornadoes on Easter Sunday

This is a worse case scenario. Tornadoes and flooded, blocked roadways making for great difficulties reaching residences affecting hard hit ...