Welcome to the last Monday of the year. Likely this will be the last post of the year. But, I do need to update all the totals on the side of the blog.
Many areas received a nice soaking yesterday, from 1-3", pretty much on target. It's amazing how these same models, though, cannot even come close to forecasting snow totals.
I recorded 1.56" at my place in Valley Station, giving me an annual total of 55.14".
Paducah finally breached 70" (3rd wettest year) while Bowling Green exceeded 60" (6th wettest year)
Frankfort tallied a record wet day yesterday with 1.68"
In addition to the wet, the recent spat of warm days has pushed some of our locations into or near the top ten warmest Decembers ever. Lexington is a lock. Paducah, Bowling Green, Frankfort, and London are all in the hunt. Louisville, though, is out.
Looking ahead to the new year, temperatures will be averaging near or above normal, at least for a the first week. I'm getting mixed signals right now about the second week. GEFS teleconnections keeps our region in a normal to above normal pattern, thanks to a strong AO+ and a PNA-. The EPO will be definitely less than what it has been recently, but still argues for at least a normal temperature pattern and keeping the coldest air to the west .
However, the latest data from the Euro forecast model has an impressive shot of cold air invading the northern US by the 8th of the month, covering real estate from International Falls to Marquette and points south all the way to the northern part of Florida. Over the next few days, it will be interesting to see if there is any lasting commitment to this blast of cold or will it go up in ashes like the recent forecasts for this upcoming winter has gone thus far from some media outlets.
Eventually, the cold will catch us. But, you can avoid catching a cold by washing your hands regularly and having those alcohol wipes nearby for wiping affected surfaces. My daughter is recovering from the Flu at the moment, but is doing better than yesterday.
Monday, December 30, 2019
Wednesday, December 25, 2019
Top Ten Warmest December?
Projection Time....
With an onslaught of very mild air statewide for the next 4-5 days, average temperatures near 20 degrees above normal, this may put locations like Lexington and Louisville in the top ten warmest Decembers ever.
Minimum average of 41.8 for Lexington needed
Minimum average of 44.8 for Louisville needed
Minimum average of 45.3 for Bowling Green needed
Minimum average of 41.8 for Frankfort needed
I am projecting all these areas to finish in the top ten, despite a cool down to near normal for the last couple days of the year.
Friday, December 20, 2019
MikJournal Moments 12/20/2019
The year is winding down. It has been another wet year for many in our region. If you look to the side of the blog, you will notice the annual precipitation. Notice how many have or are close to top ten numbers.
It appears the holiday week will feature above normal temperatures. I did some record retrieving and found that the highest temperature for December 25 at Lexington was 70 degrees in 1982. In Louisville, the highest temperature for the same day was 68 set in 1893.
The teleconnections are still not in good alignment for a significant regional winter storm for the next several days. There is a slight signal that temperatures will cool down some by the first of the year. Then again, that's what was said about December too. We'll see.
Monday, December 9, 2019
MikJournal Monday12/09/2019...Winter Threat?
Good morning. Wow. Wait a sec. What day is it? I have 55 degrees at the moment. Normal high and low temperature for this date is 48 and 32 respectively here in Louisville. Looks like another solid day above normal. In fact, the month of December has averaged at least 3 degrees above normal for the month, a far cry from what some were forecasting for this first part of December.
However, we do have a strong cold front that will knock temperatures down for a couple of days. Of immediate interest to us here in Kentucky, is not just the cold air rushing in later tonight, but a wave of low pressure developing along the front that will provide overrunning moisture for many residents of central and eastern/southeastern Kentucky.
Many forecast models are showing hefty amounts of snowfall, like warning criteria. But, the thermal profiles do not look supportive of an all snow event during the entire track of this wave of low pressure. In fact temperatures at the 500 mb level and 850 mb level, snow does not look like the precipitation of choice for many during the first part. Only after the low's departure and subsequent colder air rushing in behind it, will snowfall begin to be realized. So by the time snow is realized, the warm ground along with drier air advecting into the region should limit snowfall amounts for most of us. Still, amounts of at least 4" could be realized in the higher elevations of eastern/southeastern Kentucky.
The teleconnection patterns I follow continue to support relatively mild conditions later this week. But, another shot of cold air is expected though not until at least a week away. So more normal to above normal readings can be expected through the first half of the month. Ones who were expecting a below normal December will be biting their fingernails, hoping the second half of the month will offset the very mild first half.
MS
Tuesday, December 3, 2019
MikJournal Moment 12/03/2019
Fun Stats....
I took the coldest months of December through February and took the average of Lexington's not-so-complete 147-year climate record to arrive at an average temperature of 34.9 degrees.
Next, I took that 34.9 degrees and came up with a list of how many times each day of those months of December through February were equal to or less than the average.
I have an interesting list compiled on what may be the coldest date of winter for Lexington.
February 11.....82 times
February 8.......81 times
January 30.......79 times
January 25.......79 times
February 9.......78 times
January 15.......78 times
January 10.......78 times
December 26....78 times
For Louisville, the average was 36.2 degrees. Therefore, equal to or less than the average gave me this list...
December 26...92 times
January 24.......88 times
January 30.......87 times
January 27.......86 times
January 4.........86 times
Of course, these numbers may not reflect the same date for the coldest days on record.
For example, Lexington's coldest days ever were on January 24, 1963; January 19, 1994; February 13, 1899; and December 22, 1989.
The chart above just highlights the law of averages.
I can do the same thing with snowfall....
Lexington's date with the most measurable snowfall days during winter is....
January 7......29 times
January 30....27 times
February 8....27 times
Mark it down on your calendar Lexington.
Louisville's date with the most measurable snowfall days is...
January 30......25 times
February 8......24 times
January 12......23 times
February 11....23 times
Monday, November 25, 2019
MikJournal Moment 11/25/2019
Knoxville Downtown Airport (KDKX)
Lat: 35.97°NLon: 83.87°WElev: 827ft.
Freezing Fog
-13°F
-25°C
| Humidity | NA |
| Wind Speed | Calm |
| Barometer | 29.96 in |
| Dewpoint | N/A |
| Visibility | 0.15 mi |
| Last update | 25 Nov 9:15 am EST |
I could not help but take a picture of this from the Morristown TN NWS office for Knoxville this morning.
Now, that would be a record, IF it was accurate. Don't worry. With an expected high of 57 degrees today, that would set another record for highest spread in temperatures (nearly 70 degrees).
During the last hour, the temperature was actually 32 degrees.
MikJournal Monday Prediction for 12/02/2019
Trying something experimental with a forecast out 7 days from today. I like the Euro model, but I do have to factor in an either/or scenario. Weather systems don't always follow what we think we'll happen.
For next Monday or Tuesday the 3rd from Louisville to Lexington, temperatures will range from the mid to upper 30's with snow showers possible. NOT expecting much accumulation at all. Lows could bottom out in the low to mid 20's, depending on how much clearing takes place.
NAO and AO teleconnections look to trend positive throughout this week. This could result in at least a short term reprieve of the coldest air here regionally early next week. But, the cold air will continue to build throughout the Canadian regions, poised to invade the US northern Plains. But, we'll have to watch for future trends of the AO to determine when that could happen.
Otherwise, expect near normal to slightly below normal temperatures for the first few days of December.
Tuesday, November 19, 2019
MikJournal Moment 11/19/2019
Close Call...
Nearly 6 years ago, on November 17, an outbreak of tornadoes pummeled parts of the Midwest and affected a large real estate of western Kentucky.
In fact several confirmed tornadoes were rated EF-2 to EF-3 strength. One of the tornadoes hit a Uranium enrichment plant near Paducah.
It just so happened that earlier that year in May 2013, plans were in the works to cease operation at the gaseous diffusion plant. According to a report, operations did indeed cease in June.
Initially, there were conflicting reports of whether radioactivity somehow escaped into the air or into the ground. Also, some even questioned whether the plant had fully shut down by this time, some 5 months later, since there was some kind of expiration dating December 31, 2013.
Nevertheless, everything turned out fine. No hazardous materials or radioactivity were released thereby posing no problem to the public.
Other tornadic storms affected several more western Kentucky counties, with some reports of 500,000 to 700,000 dollars worth of damage. Only a couple of minor to serious injuries were reported but no deaths.
Last Year's Winners (Snowfall east of the Mississippi River)
Also, Mount Washington NH, "Home of the World's Worst Weather", tallied 314.3" for the snow season running from Jul 1 2018 - Jun 30 2019
Remember too, the snowfall totals above also reflect the standard snow season from Jul 1 2018 through Jun 30 2019.
Nearly 6 years ago, on November 17, an outbreak of tornadoes pummeled parts of the Midwest and affected a large real estate of western Kentucky.
In fact several confirmed tornadoes were rated EF-2 to EF-3 strength. One of the tornadoes hit a Uranium enrichment plant near Paducah.
It just so happened that earlier that year in May 2013, plans were in the works to cease operation at the gaseous diffusion plant. According to a report, operations did indeed cease in June.
Initially, there were conflicting reports of whether radioactivity somehow escaped into the air or into the ground. Also, some even questioned whether the plant had fully shut down by this time, some 5 months later, since there was some kind of expiration dating December 31, 2013.
Nevertheless, everything turned out fine. No hazardous materials or radioactivity were released thereby posing no problem to the public.
Other tornadic storms affected several more western Kentucky counties, with some reports of 500,000 to 700,000 dollars worth of damage. Only a couple of minor to serious injuries were reported but no deaths.
Last Year's Winners (Snowfall east of the Mississippi River)
| 247.9 | Redfield NY |
| 242.1 | Osceola NY |
| 231.6 | Hooker NY |
| 227.6 | Marquette MI |
| 211.5 | Bergland Dam MI |
| 207.4 | Munising MI |
| 196.7 | Perrysburg NY |
| 185.0 | Springville NY |
| 182.8 | Ironwood MI |
Also, Mount Washington NH, "Home of the World's Worst Weather", tallied 314.3" for the snow season running from Jul 1 2018 - Jun 30 2019
Remember too, the snowfall totals above also reflect the standard snow season from Jul 1 2018 through Jun 30 2019.
Friday, November 8, 2019
MikJournal Moment 11/08/2019
Lows of 25 at the Louisville airport (official) and 24 at my house this morning.
Lexington BG airport and Mesonet at 23 degrees.
A few of the usual colder spots made it into the teens this morning.
Upper teens on track for Lexington and maybe Louisville early next week; the last time each of those locations recorded a November morning in the teens was in 2015 (Lex) and 2014 (Louisville)
3rd wettest October on record for Kentucky
Barrow AK is over 20 degrees above normal through the first week of November with a hi/lo average of 26.1 degrees. That's warmer than Williston ND, Minot ND, Grand Forks ND, Duluth MN, and Marquette MI, just to name a few. What makes this more impressive is that Barrow, located near the Arctic circle, is losing daylight at an astonishing rate now that we've entered the month of November. In fact the nearly 4.5 hours of daylight today will be reduced to nothing by November 19 when the Sun will not rise above the horizon again until January 23, 2020.
Friday, November 1, 2019
Annual Rant About Winter "Forecasts"
Welcome to November! The air is quite crisp this morning. The growing season is over. Well, almost. My rosemary plant is the only one standing in the garden this morning. It's a hardy plant and can withstand temperatures down to the single digits. So, that low of 28 degrees at my house was not a big deal.
So, we had a nice foretaste of winter. I had a few snowflakes mixed with graupel and rain for the last day of October. Wind chills were impressive, too. It makes us wonder how the upcoming winter will unfold.
Well, do we have a treat for you. Guess what? It's that time of year when your favorite media source promotes its own brand of the seasonal winter forecast, using chief meteorologists, atmospheric scientists, serious professionals called upon to entertain you with a combination of high-sounding scientific jargon and a tinge of sales-pitch delivery.
Don't get me wrong. I enjoy these annual 'segments'. They are fun to watch. I like hearing how each of the television personalities concocts its own opinions about how the winter season will progress. Often, they already know what the audience wants; therefore, they develop and center their 'forecast' around the nagging questions, "How much snow will I get?" or "Will we have any ice storms?"
But, there's a conflict of interest here. You see, your local media source is generally part of a national organization, a local affiliate with FOX, ABC, NBC, and CBS. What matters to them is ratings. They could care less if a forecast is right or wrong. It's about the people who tune in to watch. What can we give them to keep them coming back?
Since many dream of those romantic scenes of a late evening snow falling peacefully onto neighborhood yards and streets illuminated by the street lights, especially around the holidays, you know, a White Christmas, bundled up in multiple layers, a scarf and hat, taking a lovely stroll along the sidewalk, and then the sheer beauty of an untouched, snow-covered field glistening in the early morning sunlight, let's have our professionals do their professional stuff but deliver it in a way that's enthusiastic, or even if there is not much hope of a snowy winter, appeal to the audience's desire and give them that glimmer of hope.
In other words, don't focus so much on your profession you television atmospheric scientists with your NWA or AMS seal of approval. Tell the people what they want to hear when discussing these 'forecasts'. Don't worry about it. Nobody is going to remember what you said, but how you said it. You said it with their feelings in mind, their concerns, their hopes. You made it your feelings, your concerns, and your hopes. Just like a salesman.
I will say that I appreciate the government-sponsored outlooks provided by the NWS or other private institutions who focus solely on providing a timely, hopefully accurate assessment of its seasonal prediction to those decision makers who rely on these outlooks. So, there is really no need for our local weather heroes to get involved in all that.
I still remember watching wrestling programs on television in the 1980's. I sure thought it was real. I kept coming back. Later, I found out it was all a show, entertainment. What a letdown! And of course, the WWF, or the World Wrestling Federation, is now called the WWE, World Wrestling ENTERTAINMENT.
I can use the same alphabet above related to these winter 'forecasts'. The WWF, or the World of Winter Forecasters should be renamed as the WWE, the World of Winter Entertainment.
Whatever the case, enjoy the show, and hopefully the snow.
MS
Wednesday, October 23, 2019
MikJournal Moment 10/23/2019
As of October 22, a new leader has emerged in the region I cover for annual precipitation. Memphis TN replaces Paducah KY for now with an impressive total of 58.78". Paducah does come in at a close second with 58.74", coming closer to a top ten annual precipitation induction, possibly replacing 2018's top ten appearance.
The month of October has brought beneficial rains for many residents after a record dry September. Some areas in Kentucky have received over 5 inches this month, while others have recorded just over an inch. But, we should see an overall reduction in drought in the next report updated tomorrow morning.
The coldest air of the season is still on track to arrive by the end of the month or the first of next month. It is looking increasingly likely that the growing season will effectively end for most of the remaining region that has not already experienced a killing frost. Widespread 20's for low temperatures and possibly upper teens in the normally colder locations might threaten a few records. Lexington's daily low temperature records for October 31 and November 1 is 22 degrees. Right now, I'm predicting 25-28 degrees. Even Louisville could see its first freeze of the season, earliest freeze since October 29 and 30, 2017.
It's been a long time, but the NAO, the North Atlantic Oscillation, has been persistently negative over the last several months. If this trend continues into the winter months, look for more opportunities for an interesting winter season, especially if you're a fan of snow and cold weather. Of course, the other major alphabet teleconnections must play their parts as well (AO, PNA, EPO).
Thursday, October 10, 2019
MikJournal Moment 10/10/2019
How does the year 2019 drought compare to other years of drought?
There really is no comparison to such years as 1953 and 1963. However, the 19 locations in Kentucky that recorded new record dry streaks for an average of 27.2 days, does compare favorably with 1985, when the average record dry streak was a little over 29.3 days for Kentucky.
But, the time period was a little bit different. Drought was becoming a hot button issue for the months of May onward, when the planting of crops was in full swing. Much of the southeast U.S. was in the grips of prolonged dry weather, from Maryland down through the Carolinas. Virginia and Kentucky were also affected moderately.
In a way, I'm sure many would like to see 1985 as an analog for the upcoming winter. January 1986 was a decent snow maker for eastern Kentucky. One snowstorm brought up to 10" to the mountains in Letcher and Harlan counties, and wind chills were reportedly in the -45 degree range.
The following month would produce more significant snow, especially around Valentine's Day, when heavy snow blanketed much of Kentucky with 4-12".
Unfortunately, it warmed up soon afterward, so that rain and snow melt produced widespread flooding concerns, mudslides, and collapsed awnings.
I don't know about you, but this could be a decent winter if you like snow. Still, I think the eastern part of the state will fare the best.
Sunday, October 6, 2019
MikJournal Moment 10/06/2019
Lexington's historic 39-day dry streak, from August 28 through October 5, is likely coming to an end today. Records go back to 1872, but many annual records were incomplete. However, in 1908, from August 22 to September 27, no measurable precipitation was recorded. Therefore, it was generally accepted that this 37-day dry streak was the previous record.
The region's first widespread, soaking rainfall in well over a month, will benefit many residents in Kentucky. Hopefully, areas of central Kentucky will receive enough rainfall to alleviate worsening fire dangers to parts of the Daniel Boone National Forest.
Earlier this month, temperature records fell across the region. The first few days of October produced all-time record high temperatures for the month of October...
October 1-3
Louisville...97; 97; 96
Lexington...97; 96; 96
Bowling Green...97; 98; 97
We know how warm it has been? Here's another first for Lexington...
It's what is called the Heating Degree Day, based on an average temperature of 65 degrees. Any day's average temperature that falls below the 65-degree average is added daily and tallied at the end of the month or year. At no time during September did the average temperature fall below the 65-degree average, or 0 HDD. That has never happened in September at Lexington's climate reporting stations.
How dry has it been? Well, we remember how wet the past year and a half have been. But, since July 1, here is a look at the cumulative below-normal rainfall anomalies for select locations in central Kentucky (through October 5)...
Louisville...-7.11"
Lexington...-5.60"
Covington...-3.48"
Monday, September 30, 2019
MikJournal Monday 09/30/2019...Record Setting Month Coming to a Close
Good last Monday of a memorable month of September. You are witnessing something that may not be repeated for a very long time.
Several locations like Louisville and Lexington will record their hottest and driest September ever. In fact, it will be the driest month of any year for the respective climatological records.
But, October looks to start out the same way. Therefore, places like Louisville and possibly Lexington will likely set all-time record high temperatures for the month of October.
As you may have noticed, I have not posted a Welcome page for Autumn yet, because it's been too hot. But, temperatures are soon going to return to normal October standards by the end of this week.
At Lexington, annual precipitation stands at 36.51", just 2.03" above normal for the year. This same time last year, we were closing out a record-setting wet month that bolstered our annual precipitation to 53.75". Wow. What a difference a year makes, from record wettest September in 2018 to record driest month ever 2019.
So, with the cooler air slated to arrive later this month, one would expect a nice line of beneficial rain to impact the area. Well, not so fast my friend. Although some forecast centers like WPC are showing beneficial rainfall for parts of central Kentucky by next Sunday, current local forecasts show dry weather for the rest of the week, with a slight chance (<=20 %) by sometime next weekend, perhaps awaiting future data to determine if the rainfall will be meager or actually for real this time.
Therefore, for places like Lexington, their record 37 day dry streak looks to be in jeopardy. At 33 days currently, if it does not rain by this Friday, a new record will be established.
Annually, it's looking more and more difficult for Lexington to eek out an above normal year in the precipitation department. This could be the driest year since 2012, when Lexington finished nearly 2.5" below normal for the year.
I will post some MikJournal Moments this week, highlighting records and expanding on any hope for substantial rainfall for our region.
Thanks for checking in. Now, I'm checking out. Have a good week.
MS
Thursday, September 19, 2019
MikJournal Moment 09/19/2019
According to the weekly Drought Monitor, 67 percent of Kentucky is abnormally dry. 26.26 percent is in at least a D1 drought. Burn bans have been issued in at least 50 counties in Kentucky.
Drought conditions forecast to persist through December 31 for portions of central and east Kentucky.
The July-September time frame could be the driest period since 1999 for Louisville. I'm projecting about an inch for the month of September, which would almost equal 5.00" for the period. The only other periods in Louisville's historical climate for July-September when precipitation amounts were under 5.00" were 1999, 1983, 1943, 1941, 1940, and 1930.
Dry streak records continue to fall this week...as of September 17
Corners...20 days
McDaniels...20
Salyersville Water Works...20
Taylorsville Lake...20
Sunday, September 15, 2019
MikJournal Moment 09/15/2019
Dry Update:
19 consecutive days with no measurable rainfall at my house in Valley Station, KY.
19 days...Louisville International
18 days...Louisville Bowman Field
18 days...Lexington Bluegrass AP
Dry Streak Records Threatened:
Inez...17 days (19)
London...17 days (23)
Louisville Bowman Field...18 days (23)
Impressive Dry Streak and Temperatures
Louisville International 1953:
36 days of no measurable rain (not a record)
Temperature high/low examples:
09-29......99/52
10-19.....86/43
Monday, September 2, 2019
MikJournal Monday 09/02/2019...Welcome to Meteorogical Autumn
Yes. Good Monday and the first day of meteorological Autumn. But, this does not mean Summer is going away completely. It's a nice day out there today, and it's a little warm.
However, we're looking at an awesome forecast for the week, especially later this week.
First, headline hog Hurricane Dorian has just been downgraded to a category 4 storm as I'm writing this, shortly after the noon hour. The thing is barely moving. Soon, a weakness between 2 ridges will allow the Big 'D' an opportunity to sneak through and begin its north and eventual northeastward swim, perhaps staying offshore but not far enough for any impacts to be lessened along a huge swath of the southeast coastline.
The forecast for high winds, relentless surf, and other flooding concerns has already prompted a mass evacuation plan from the coastlines of Florida to South Carolina. Even my favorite vacation spot at Myrtle Beach looks to be cancelled later this week, as the State Park is officially closed until further notice. Bummer!
I'm quite sure we'll hear complainers yacking about "why did they have to evacuate?" Oh, and my personal favorite, "People are just getting too soft these days."
I do not see any real good chances for rainfall in our region for the next several days. Although the majority of the state of Kentucky is still considered to be above average in the rainfall department for the year, I am projecting that the August numbers will show that the state was 'below average' for the first time this year. And this may even knock Kentucky down a level to 'Near Average' albeit the high end of that level for the calendar year 2019.
Well, I hate to cut the post short, but I do have to find some alternative vacation plans.
Talk later...
MS
Sunday, August 25, 2019
A MikJournal Moment 08/25/2019
A possible pattern change for some...
Widespread rainfall anticipated over much of Kentucky this week with 1-3" expected, relieving areas that have had little rainfall over the last 2 months.
Jackson KY still looks dry...
At only 0.17" for the month of August, Jackson could use some much needed rainfall. Hopefully, they get in on it. At least an inch is expected over the next few days.
Mesonet sites still under 1" for the month...
There are still 12 Kentucky Mesonet locations that have not received at least 1" of rainfall for the month, mainly confined to areas of the Bluegrass region in central Kentucky.
It was a dry July in Louisville...
The 1.31" was the driest July in Louisville since 2002.
Charleston WV gets more rain...
Coming close to going below normal for the year in the rainfall department, Charleston picked up 2.69" during the past week.
Death Valley temperatures...
Highest temperature this summer has been 125 degrees. During July, the warmest low temperature for the month was 102.
MS
Monday, August 19, 2019
MikJournal Monday 08/19/2019...Change From Hot and Dry?
Good Monday morning. I awakened to some computer issues this morning. That's always fun. Hopefully, this post will make it to your screen.
Anyway, let's talk weather. More and more people living in Kentucky are beginning to understand what I've been dealing with for several weeks here near Louisville: a lack of rainfall.
It has rained only two days this month for a drought-busting 0.71" at my place in Valley Station. I heard thunder around 1:00 this morning, but no rainfall here once again. The airport picked up 0.01" and now has 0.60" for the month. Yay!
Through yesterday, there were 22 Mesonet sites in Kentucky that have registered less than 0.50" this month. The Drought Monitor report due this Thursday will likely show an expansion of the 'abnormally dry' areas. I still don't think anyone really qualifies for moderate drought status yet.
And it appears that nobody will. Maybe. The CPC has our region in a 40-50 percent chance for above normal rainfall in the day 6-10 time frame. But, that drops to a 33-40 percent chance for above normal readings in the 10-14 day time period.
Temperatures that have been soaring well into the 90's lately, flustering meteorologists who make forecasts, will be coming down. I mean we're not talking record lows here, but it should feel much better than what we've been dealing with here lately.
In the meantime, here is something we do not regularly talk about during the summer months, a top ten list of driest months.
I know we still have 12 days to go before the end of the month. But, for those who are curious, here are a few locations who stand a realistic chance of making the top ten driest August list. In the list below, I used the 10th place value. Obviously, that means anything greater than that amount will not be on the list.
Louisville....0.96" (0.60")
Lexington....1.26" (0.41")
Jackson........2.64" (0.07")
London........2.02" (0.00")
As for temperatures, yesterday really highlighted what a dry ground can do for temperatures. Several areas of central and eastern Kentucky soared into the mid 90's. Lexington recorded a high of 97 degrees, beating out Louisville's 96. These values only add more intensity to sucking out the moisture from an already dried out ground, or at least the top few inches of the soil.
So, let's hope for some much needed rainfall. The CPC gives us a fair shot for above normal rainfall along with the beleaguered GFS.
Have a good week everyone.
MS
Monday, August 12, 2019
MikJournal Monday 08/12/2019...Mid-Month Update
Happy Monday to one and all, the beginning of another week of summer. And boy, will summer be playing the part.
After a brief respite from the throngs of summer heat, it's coming back with a vengeance, perhaps the hottest temperatures of the year for some, especially if you're inclined to believe the naysayers about the 'fake' excessive heat from a couple of weeks ago.
Along with the heat, there might be a chance of...wait for it...rain??? Say it ain't so! Well.... I'm not going to say much about that, other than some of us might still be dealing with brown/dormant lawns. But, let's hope that some of us will get in on those beneficial rains.
Louisville, officially, has only had 1.31" since July 1.
By comparison, Louisville has received just 0.32" since July 24. Death Valley CA has recorded 0.22" during the same time frame.
According to the CPC, precipitation chances should begin to normalize, especially after next week. We will see about that. Even hotter temperatures are forecast after the middle of the month. Either we're talking about high heat AND humidity, or else high heat with little chances for precipitation. Regardless, overall temperatures will be above average throughout the period through at least the 24th of the month.
Paducah continues to lead all reporting locations in Kentucky in the precipitation department with just over 52" for the year. That's good enough for 28th wettest year on record so far.
For the rest of us, abnormally dry conditions will likely spread from last week's figures with the next Drought Monitor report this Thursday. Many could use at least 1-2" rainfall. I know I could use it.
Here's something you won't see often. This is the Las Vegas NV forecast page. Excessive Heat Watch for the southern part of the state and in the favored desert areas while Frost Advisory for higher elevations of central and northern Nevada.
Have a good week, everyone.
MS
Monday, July 22, 2019
MikJournal Monday 07/22/2019...A Break in the Heat
Welcome to another edition of my Journal for this Monday morning July 22, 2019. Today is T-day. No, I don't mean thunderstorm day, but Transition day, a well-deserved respite from the heat AND humidity beginning later today and tonight that takes us through the rest of the week.
This morning is still quite muggy. Shower chances will be modest, and rainfall amounts will vary today. Afterward, a sharp contrast in air masses takes place. Much cooler and drier air takes over with oppressive dew point readings that were well into the 70's being replaced by readings in the 50's. Temperatures in the low to mid 90's knocked down to the low and mid 80's. That's right. Instead of "feel like" temperatures in the 100-105 degree range, it will feel 20-25 degrees cooler. Summer's version of a Polar Vortex. Well, relatively speaking.
Rainfall chances go down after today. So, if you needed the rain, today's the day. If you didn't need the rain, this is your week.
Checking the numbers for Louisville and Lexington, both 'official' locations are now running behind last year's record rainfall totals. It's amazing how some areas have received little rainfall this month contrasted with nearby areas.
For example, Lexington's Bluegrass airport has received 2.42" for the month of July. The Mesonet site about 6 miles away "as the crow flies" has tallied 4.69".
Here in Louisville, the official location has recorded just 0.98" for the month whereas a 21-mile "as the crow flies" trek along I-64 and US 60 to Simpsonville has totaled 4.62".
Putting aside the Geography bee for the week, I would like to take this opportunity to express my disappointment for some people who feel that we are "getting too soft" when it comes to the heat. Instead of relaying the basics of heat safety and all the practical precautions, why do such ones need to poke fun at why the NWS offices coordinated an Excessive Heat Warning for millions when most of us never exceeded those ranges?
Well, why you are at it, why not poke fun at residents living in Brooklyn, Long Island, and Queens NY where the heat has resulted in a strain on its power grid resulting in outages of greater than 24 hours? Do me a favor, turn your power off, no air-conditioning, no fans, in this kind of heat, and let me know how you feel later. Let's see how tough you are.
Better yet, give up your inside job for a day and come outside and work with me. Show me what you got.
Then, why not publicly voice your sentiments to the families who lost 6 loved ones to the heat this week and explain to them that their loved ones were just not tough enough...they were too soft.
No, we're not getting soft, we're getting smart.
I say kudos to the staff at Yankee stadium for setting up supplemental hydration stations on all 3 decks and the bleachers while making announcements over the Public Address system to the fans to keep drinking water. That's not being soft, that's being smart.
And as for those 'exaggerated' heat warnings issued by the NWS offices, I say "Thank you". And thanks for posting those necessary reminders for heat safety. Yes, thanks for being one of the smart ones around here.
Make it a great week, people. The weather is going to be great. Enjoy!
MS
Monday, July 15, 2019
MikJournal Monday 07/15/2019...Mid-Month Update
Good Monday morning and welcome to this installment of my Journal. Over the past two weeks, I have certainly dried out here at my place in Valley Station, just outside of the great heat island called Louisville. Others, though, are still posting impressive rain totals, adding to yet another waterlogged year.
I have recorded only 0.02" for the month of July, and that was on the 3rd. No measurable rainfall since then. I'm not alone, though. Covington has only recorded 0.02" for the month so far and even matches my annual total of 35.63".
Here's another stat for the "Have Nots" club that I had to place on a separate line. The Boone county Mesonet has not recorded any measurable precipitation since June 24. That is nearly 3 weeks!
But, then, you have the other side, too much rain.
Jackson has already received nearly 4" for the month. In addition, Paducah has already picked up 3.39" to add to its incredible total of over 47" for the year so far. That is over 20" above their normal precipitation amount by now.
Recently, I reviewed the State of the Climate report and found more records were broken. The period from July 2018 through June 30 2019 was the wettest ever, not just statewide, but nationally.
Here's something that will cool you off. As of July 13, the National Operational Hydrologic Remote Sensing Center's National Snow Analyses page now displays 0.0% of the area covered by snow. Sure, there is some snow on the higher summits somewhere nationally, but not enough for the percentages. This compares to July 3 of last year when the area covered by snow nationally was also 0.0%.
Yet, it appears that snowfall for many locations was down for the year.
I have nearly finished my annual report of the 10-foot snow club for the snow season ending June 30 for locations east of the Mississippi River. Some 70 locations registered totals of over 120" and includes cities like Marquette MI and Caribou ME. Be looking for it by the end of the week here in another Journal entry.
Here is your geography bee for this Monday. The mighty Mississippi river. We all know where it ends. But, where does it begin? One would have to travel to Minnesota and visit the Itasca State Park, claimed to be the 2nd oldest state park in the United States behind Niagara Falls. There, you will find a small glacial lake called Lake Itasca. From its humble beginnings at nearly 18 feet wide, the headwaters of the Mississippi River begins its 2,500+ mile journey, eventually ending in the Gulf of Mexico. Here is your personal view of those headwaters....
https://www.dnr.state.mn.us/state_parks/Itasca/headwaters.html
Have a good week everyone.
MS
Monday, July 1, 2019
MikJournal Monday 07/01/2019...Mid-Year Stats
Welcome to the mid-year edition of my Journal. Doesn't it seem like the first half of this year just picked up where last year left off? Wet. Quite likely, another new 12-month precipitation record, this time from July 2018 through June 2019, will be set for Kentucky, possibly replacing last month's all-time 12-month record.
London recorded 12.22" for the month of June, obliterating its previous wettest June on record.
London also recorded its wettest month on record for any month of the year, beating out the previous record of 12.16" set in December 1990.
Jackson 3rd wettest June
Covington/Cincinnati 4th wettest June
Louisville 6th wettest June
Bowling Green 9th wettest June
Lexington and Frankfort fell just outside of their top ten wettest June's on record.
After last evening's rainfall, my June total surpassed the 10" mark, coming in at 10.08". My annual total now stands at 35.61", well ahead of last year's mark at this time.
Oh, and by the way, you will be pleased to know that little sliver of west or south-central Kentucky that was in an "abnormally dry" shading was officially removed during the latest drought monitor report.
Surprisingly, most areas finished near to slightly below normal in the temperature department. This past week of drier and hotter weather really helped out.
I'm seeing signs of an overall national and global shift in temperatures. For the past few years, we have been experiencing much warmer than normal readings, top 5 rankings at least. Hopefully, the cooler pattern we are seeing now will continue and help temper the extreme weather events many locations have experienced over the last several years.
I talked to a farmer from Indiana yesterday, and he said his watermelon crop is a near-total loss. Some fields of central and southern Indiana still have water overlaying the land, prohibiting some from even planting their crops. He informed me that some farmers say this is the worst they've seen it in several decades.
I guess in some ways, too much water is worse than a drought.
Well, the end of the snow season occurred yesterday. You can check out the blog statistics and compare your location with several NWS sites. Some of my favorite tracking locations near the Tug Hill region of western New York saw much less snow this past year compared to previous years. I'm still working on finalizing that data.
Your geography bee of the week has to deal with another "Tug" in its name, the Tug Fork of the Big Sandy river. For years, I always thought the feud of the infamous Hatfield's and McCoy's were separated by a fence. Well, in this case, it's the liquid fence of the Tug Fork, separating Kentucky and West Virginia.
It's been a fascinating, albeit confusing read, these Hatfield's and McCoy's. There were so many of them. And despite the many bloody events, several Hatfield and McCoy members were married to each other, which made it even more difficult to keep track who was supporting what side, if any.
Anyway, it's a piece of Kentucky history. Go to Pikeville sometime or the eastern part of Pike county, where the McCoy's occupied much land. See the other side, where the Hatfield's lived, just across the river in West Virginia.
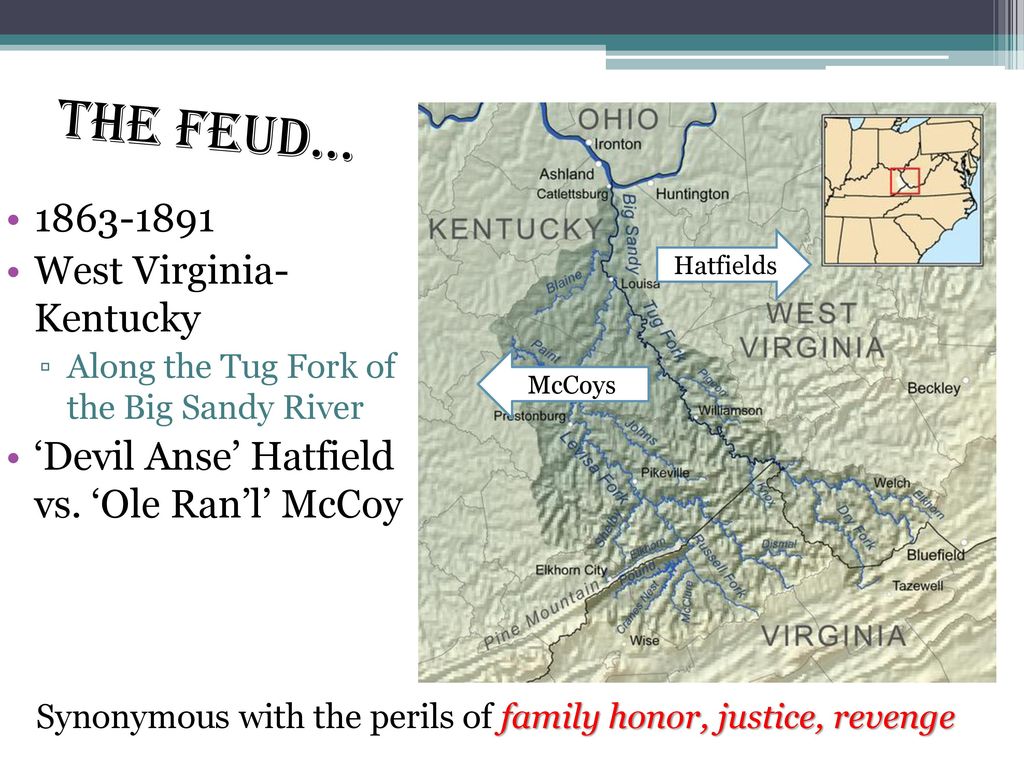
From a slide on a page of history.com
Meanwhile, have a good week. Have a safe one too.
MS
London recorded 12.22" for the month of June, obliterating its previous wettest June on record.
London also recorded its wettest month on record for any month of the year, beating out the previous record of 12.16" set in December 1990.
Jackson 3rd wettest June
Covington/Cincinnati 4th wettest June
Louisville 6th wettest June
Bowling Green 9th wettest June
Lexington and Frankfort fell just outside of their top ten wettest June's on record.
After last evening's rainfall, my June total surpassed the 10" mark, coming in at 10.08". My annual total now stands at 35.61", well ahead of last year's mark at this time.
Oh, and by the way, you will be pleased to know that little sliver of west or south-central Kentucky that was in an "abnormally dry" shading was officially removed during the latest drought monitor report.
Surprisingly, most areas finished near to slightly below normal in the temperature department. This past week of drier and hotter weather really helped out.
I'm seeing signs of an overall national and global shift in temperatures. For the past few years, we have been experiencing much warmer than normal readings, top 5 rankings at least. Hopefully, the cooler pattern we are seeing now will continue and help temper the extreme weather events many locations have experienced over the last several years.
I talked to a farmer from Indiana yesterday, and he said his watermelon crop is a near-total loss. Some fields of central and southern Indiana still have water overlaying the land, prohibiting some from even planting their crops. He informed me that some farmers say this is the worst they've seen it in several decades.
I guess in some ways, too much water is worse than a drought.
Well, the end of the snow season occurred yesterday. You can check out the blog statistics and compare your location with several NWS sites. Some of my favorite tracking locations near the Tug Hill region of western New York saw much less snow this past year compared to previous years. I'm still working on finalizing that data.
Your geography bee of the week has to deal with another "Tug" in its name, the Tug Fork of the Big Sandy river. For years, I always thought the feud of the infamous Hatfield's and McCoy's were separated by a fence. Well, in this case, it's the liquid fence of the Tug Fork, separating Kentucky and West Virginia.
It's been a fascinating, albeit confusing read, these Hatfield's and McCoy's. There were so many of them. And despite the many bloody events, several Hatfield and McCoy members were married to each other, which made it even more difficult to keep track who was supporting what side, if any.
Anyway, it's a piece of Kentucky history. Go to Pikeville sometime or the eastern part of Pike county, where the McCoy's occupied much land. See the other side, where the Hatfield's lived, just across the river in West Virginia.
From a slide on a page of history.com
Meanwhile, have a good week. Have a safe one too.
MS
Monday, June 17, 2019
MikJournal Monday 06/17/2019...Precipathon II
Welcome to another Monday edition of my Journal. It's starting out on a soggy note. Then again, what else is new?
We are now in the midst of another long-duration rain event, affectionately I call Precipathon part 2, like a marathon rain event, similar to one we had earlier this month.
Locations like Louisville and Covington/Cincinnati could be looking at top ten June Precipitation records before this week is over.
I'll be doing my best to update annual totals on my blog. But, please understand, it's a very 'fluid' situation. Yeah, I know. Weather geeks like myself just can't resist.
Seriously, though, the rainfall totals in some areas are becoming dangerous. Reports of water rescues over the weekend and a report of a landslide in Powell county destroying a home are just a few of the issues confronting residents and drivers.
While it will not rain the entire time, our region is placed in the proverbial bull's eye for episodic bouts of heavy rain. The convective nature of the storms this week could dump a lot of rain over one location while another location not too far away sees very little.
NWS Louisville has already put out numbers of an additional 2 - 4" for the week ahead. Again, that's on top of the 1 to nearly 4" that has already fallen over the past couple of days.
Your geography bee of the week...
Although Interstate 90 is the longest interstate in the United States at just over 3,000 miles, the longest road in the United States is Route 20, at over 3,300 miles, the scenic route if you will, which runs roughly parallel to the I-90 and includes Boston MA at one end to Newport OR at the other.

(photo HistoricUS20)
Have a nice week everyone. Stay safe.
MS
We are now in the midst of another long-duration rain event, affectionately I call Precipathon part 2, like a marathon rain event, similar to one we had earlier this month.
Locations like Louisville and Covington/Cincinnati could be looking at top ten June Precipitation records before this week is over.
I'll be doing my best to update annual totals on my blog. But, please understand, it's a very 'fluid' situation. Yeah, I know. Weather geeks like myself just can't resist.
Seriously, though, the rainfall totals in some areas are becoming dangerous. Reports of water rescues over the weekend and a report of a landslide in Powell county destroying a home are just a few of the issues confronting residents and drivers.
While it will not rain the entire time, our region is placed in the proverbial bull's eye for episodic bouts of heavy rain. The convective nature of the storms this week could dump a lot of rain over one location while another location not too far away sees very little.
NWS Louisville has already put out numbers of an additional 2 - 4" for the week ahead. Again, that's on top of the 1 to nearly 4" that has already fallen over the past couple of days.
Your geography bee of the week...
Although Interstate 90 is the longest interstate in the United States at just over 3,000 miles, the longest road in the United States is Route 20, at over 3,300 miles, the scenic route if you will, which runs roughly parallel to the I-90 and includes Boston MA at one end to Newport OR at the other.
(photo HistoricUS20)
Have a nice week everyone. Stay safe.
MS
Monday, June 10, 2019
MikJournal Monday 06/10/2019...Impressive Rain Totals
Good Monday to you. Hopefully, it's a bit drier where you are today. Impressive rain totals over the last 5 days or so.
I recorded 3.92" during this time. Thankfully, the lush green vegetation surrounding my house now helped to capture and absorb the liquid before anything could invade my basement.
Other locations saw over 6.5" for the same time period, such as Barren county Mesonet near Glasgow. Casey county Mesonet also recorded over 6" for the event. Two to four inches were quite common across several areas of central and east Kentucky. At times, the rainfall was so intense, flash flooding occurred in not less than a few locations.
Hopefully, we can dry things out, get some much needed yard work done, and then do it all over again, this time not as much rainfall...hopefully.
Your geography bee for the week is...Sawyer KY in McCreary county, just north of Cumberland Falls State Resort Park, and Sault Saint Marie MI share a very close approximation in terms of longitude coordinates (the west to east coordinates). Of course, the latitude coordinates, or north-south coordinates are much different, approximately 9.5 degrees difference. When I would chase storms, I often used the Great Circle Formula to determine how far away storms were versus how much time would be needed to drive and intercept (storms don't use the highway most of the time). Using the formula, one can calculate the distance between the two locations(as the crow flies, not actual driving miles)....
Converting the latitude and longitude coordinates from degrees to radians for the two locations(E2 and E5 radians) and (F2 and F5 radians) respectively and using this sample formula from my Excel spreadsheet, here is the distance...
=6367*ACOS((SIN(E2)*SIN(E5))+(COS(E2)*COS(E5))*(COS(F2-F5)))/1.609
Distance is 663 miles
Have a good week.
MS
I recorded 3.92" during this time. Thankfully, the lush green vegetation surrounding my house now helped to capture and absorb the liquid before anything could invade my basement.
Other locations saw over 6.5" for the same time period, such as Barren county Mesonet near Glasgow. Casey county Mesonet also recorded over 6" for the event. Two to four inches were quite common across several areas of central and east Kentucky. At times, the rainfall was so intense, flash flooding occurred in not less than a few locations.
Hopefully, we can dry things out, get some much needed yard work done, and then do it all over again, this time not as much rainfall...hopefully.
Your geography bee for the week is...Sawyer KY in McCreary county, just north of Cumberland Falls State Resort Park, and Sault Saint Marie MI share a very close approximation in terms of longitude coordinates (the west to east coordinates). Of course, the latitude coordinates, or north-south coordinates are much different, approximately 9.5 degrees difference. When I would chase storms, I often used the Great Circle Formula to determine how far away storms were versus how much time would be needed to drive and intercept (storms don't use the highway most of the time). Using the formula, one can calculate the distance between the two locations(as the crow flies, not actual driving miles)....
Converting the latitude and longitude coordinates from degrees to radians for the two locations(E2 and E5 radians) and (F2 and F5 radians) respectively and using this sample formula from my Excel spreadsheet, here is the distance...
=6367*ACOS((SIN(E2)*SIN(E5))+(COS(E2)*COS(E5))*(COS(F2-F5)))/1.609
Distance is 663 miles
| from | lat | long | lat(rad)e2 | long(rad)f2 | |
| ssm | 46.4977 | -84.3476 | 0.811538 | -1.4721433 | |
| to | lat | long | lat(rad)e5 | long(rad)f5 | |
| sawyer | 36.9001 | -84.3516 | 0.6440282 | -1.4722131 | |
| 662.8555 | miles |
Have a good week.
MS
Monday, June 3, 2019
MikJournal Monday 06/03/2019...Wet Threat
Hey, hey! Welcome back to an overdue Monday edition of my journal. Wow, time flies. It's already meteorological summer. School is just about out for the kiddos here in Jefferson County. The garden is in full swing. Lots of pepper plants this year, including habanero and ghost pepper along with a chili pepper and a couple of Marconi pepper plants, a few sweet bell pepper and Big Bertha bell plants. And of course, tomato plants, including one I am experimenting with in a bale of straw. I have never tried it before and thought I'd give it a go. Looking forward to fried green tomatoes and some hot salsa later this summer.
In case you missed it, have a look at this....
here
That's right, pre-drought conditions. Who'd ever thought we would be talking about abnormally dry weather after such a wet winter? But, there you have it. Because by this time next week, that abnormally dry condition will be gone.
We have an abundance of moisture poised to invade our region. In fact, some locations could see rain totals exceeding 4" by this time next Monday. Stay tuned. In addition, convective activity looks to be strong to severe at times for many of us. We could even have multiple rounds of severe weather. Again, stay tuned to your favorite media source for the most up-to-date information.
I'm a big geography buff, so here is a couple of interesting statistics you might enjoy. The state of Delaware has just 3 counties, making this state the one with the least amount of counties, whereas Texas tops the list with an astounding 254 counties, equal to the combined counts of the commonwealths of Virginia(134) and Kentucky(120) who are ranked 3rd and 4th highest respectively.
Have a good week. And keep alert to those possible hazards this week.
MS
Monday, February 25, 2019
MikJournal Monday 02/25/2019...Drying Out
What a wet pattern we have been enduring. Will we finally dry out? Welcome to another installment of MikJournal Monday, the 25th of February, when the average high temperature for this date in Louisville, Kentucky has historically averaged out to 48.2 degrees.
Yes, it has been a very wet month of February. I am still in the process of updating totals for the blog. However, one thing I haven't needed to update, at least locally, is the snowfall. And perhaps many of us would like to see some snow just as long as it is not rain, because we have had way too much of that.
Here is a profound statement. Many places in Kentucky have seen more than twice as many inches of rainfall than snowfall. Shouldn't that be the other way around for a normal Dec-Feb winter?
There have been no shortage of reports statewide regarding our flooded streets, yards, and rivers. Social media stepped up and provided invaluable imagery and descriptive accounts of what was happening in their own communities or nearby locations.
Nevertheless, please be careful. Don't sacrifice safety just to 'beef up' the number of hits for your social media account. It's just not worth it. Live to see another day. Right?
Now, what everyone wants to know is, "Are we ever going to get out of this wet pattern?"
Unfortunately, the teleconnection patterns I follow have changed very little and are forecast to show little change. However, there does appear to be a pattern shift. No, not a change, but a shift. What do I mean?
After a nice period of drying out this week, much cooler weather appears in the extended forecast. Hopefully, this means the main conveyor belt of moisture will now shift to the south of our region. Yes, the moisture will continue to be richly fed by Pacific air and the Gulf of Mexico. However, any storm systems might take a more southern route .
The Climate Prediction Center, in its 6-10 day outlook for the first week of March shows below normal temperatures and a chance for above normal precipitation for our region. We don't want to hear that part, above normal precipitation. However, the exciting part is that some of that precipitation might not fall as all rain.
Although the teleconnection patterns do not favor a significant winter event for Kentucky, the setup does favor overrunning moisture, which could lead to some wet snow or perhaps icing problems. Again, nothing significant...yet.
Overall, it does appear likely our region will see below normal temperatures, on average, for the first 10 days of March. We will see about that.. If the NAO continues its run of neutral/positive readings, we should see some milder days but offset by more cooler days. I'm not ready to say this will be a record cold March coming up. Any polar intrusions will be short-lived, because the dominant pattern will be Pacific air, at least through the early part of March.
That's all I have for today. Make it a good week. Remember, less than 4 weeks from now, Spring.
MS
Monday, February 18, 2019
MikJournal Monday 02/18/2019...Memorable Storm System This Week
First, I would like to apologize for last Monday's post. As you saw, there was nothing updated. However, I can say that I was affected by last week's flooding. Thankfully, no damage, but very little sleep over a 36-hour period. In addition, I have my 'normal' work that I actually get paid for. Of course, it was a very busy week with the holiday and all.
Now for this week. Uh, deja vu? Whatever that means. But, we will have another significant weather system affecting our region. And yes, there is now a likely chance that more flooding will occur throughout the state.
I have to put this on a separate line, because you have to see what forecast amounts are expected...
3 - 8" through next Sunday
...of rainfall! Most people would be happy, if not a little hesitant though, if accumulations of 3 - 8" were all snow.
Teleconnections do not favor any kind of significant winter storm for our region. However, this storm system is going to have it all. Rain, Freezing Rain, Snow. And some of the winter aspect could impact our region for a time.
Also, this could become a crippling ice event for some near the Blue Ridge mountains and along either side of the VA/NC borders. Freezing rain will not be too far away from us here in Louisville. Areas just north of the Ohio river could see some impacts.
But, the big story for us will be the heavy rainfall expected this week.
Right now, a wave of rainfall along a frontal boundary will produce efficient soaking amounts of 1 - 3" just for the Tue/Wed time frame for much of central Kentucky. Afterward, the axis of additional heavy rainfall for later this week becomes a little murky, no pun intended.
But, locations of south-central to eastern Kentucky appear to be in the bullseye for the upper end of forecast amounts this week. This does not mean areas of Louisville and Lexington are out of the woods for the heaviest rainfall. Low confidence in the exact trajectory of the storm system is hampering the forecast. But, somebody is going to get a lot of rain.
My homemade rain gauge is going to get a workout this week.
I will 'try' to post amounts, perhaps in a separate blog post. But, if you don't hear from me, I am probably babysitting the basement.
Stay safe out there. Don't be that person who gets trapped by rising floodwaters while driving through it. Watch out for all of those potholes, too. Man, I got some that will swallow a car around here.
MS
Monday, February 11, 2019
MikJournal Monday 02/11/2019...SPECIAL: Flooding and Rain Reports This Week
I will be updating this page at least through Tuesday evening. Then, with renewed chances for more rainfall later this week combined with rising river levels, I will revisit this page and update rain totals locally and statewide. Therefore, I will not be updating any snow totals such as Lake Effect Snow Machine and Miscellaneous Regional Snowfall so that the primary focus will be on this severe weather event.
Again, check back here for the latest....
MS
-----------------------------------------
Again, check back here for the latest....
MS
-----------------------------------------
Monday, February 4, 2019
MikJournal Monday 02/04/2019...February Outlook
Welcome to another installment of my MikJournal Monday, which includes your February Outlook. Even though I am a huge fan of snow, the weekend weather was just what I needed. And this touch of Spring will continue for the majority of the work week. But, it comes with a price. Rain, possibly lots of rain for our region.
The WPC for the next 7 days: 4 - 6" central and west Kentucky; 1.5 - 3.5" east of I-75.
The NWS office here in Louisville is advising residents to keep an eye on the latest forecasts as Flood Watch products may become necessary later this week.
Now, for your February Outlook....
I will bombard you with some of my reliable sources that could help us see how this month may unfold. If you like snow, you may have to wait until the second half of the month.
My favorite teleconnections: AO, NAO, PNA, EPO
The AO is forecast to go from negative to positive, then trend back toward neutral by the middle of the month.
The NAO has been a persistent roadblock to a regional (state of Kentucky) display of winter weather. It remains mostly positive, but some of the ensembles are pointing toward a more neutral/slightly negative pattern by mid-month.
The PNA has been very negative, which keeps our region, for the moment, supplied with rich Pacific air and mild temperatures. It, too, should begin to trend toward a more positive state by the middle of the month, suggesting cooler temperatures.
The EPO has been mostly negative, but the results of the other 3 teleconnections have virtually rendered the EPO null and void, for the time being.
So, just like last month, the first part of February looks quite mild and wet. That leads us to the second half of the month. I do not believe the second half of February will be as cold as the second half of January. Old Man Winter about pulled off a comeback but fell just short last month. But, February will need help from the NAO if any prolonged cold is to stick around. The higher sun angle, longer days, no cold air will want to hang around unless we have a good old fashioned block. Otherwise, this meteorological winter will be toast, well-done toast.
I've lowered my estimate from a 20-25% chance for a below normal winter temperature regime to about 15-20%.
Significant snowfall still looks possible. Regionally, still looks doubtful. Hopefully, I will be able to post a mid-month update and have a clearer picture of how the second half of February will fare.
Other miscellaneous sources ....
CPC...through the middle of February: Near normal to above normal temperatures and above normal precipitation
ENSO: currently, a weak El Nino in progress
CFS Outlook: near normal temperatures and near normal to above normal precipitation for February.
Have a good week, everyone.
MS
Monday, January 21, 2019
MikJournal Monday 01/21/2019...Below Normal Temperatures and Snow?
Good cold, very cold Monday morning to you. As I write this post, my temperature has touched 5 degrees with about a 2" snowpack. I hope my rosemary plant survives. Last year, we had a multi-day stretch of single digit temperatures that was just too much for its survival. This time around, I tried to put some dried stalks left over from my garden in, on, and around the plant hoping that will stave off the plant's imminent demise.
Anyway, if it does survive, I'll probably harvest quite a bit of the rosemary and cut the rest down to the ground, then place some leaves and stalks around the plant to protect it for the rest of the winter. Because, we have additional shots of Arctic air coming this way with more single-digit temperatures possible.
Currently, there are a few locations that are below zero this morning. As I mentioned in my last installment of MikJournal Monday, there will be more cold air intrusions than warm episodes, and that will lead to an overall below average temperature pattern for, perhaps, the rest of the month. This does not mean we won't see temperatures warm up some, but the cold air will be more entrenched and inclined to stay longer. Well, welcome to winter.
Looking at the CPC's 8-14 day outlook, temperatures are expected to be below average, a 70-80% chance. That takes us through February 3. Precipitation is expected to come in near or even slightly below normal during this same time.
Interpreting that scenario, it appears that we will have less southern-fed systems and more of a NW flow that typically has a few clippers and other minor disturbances moving through the flow. Small accumulations of snowfall and other precipitation should be expected. However, over the next couple of weeks, there is always the chance for an 'overachiever' to help boost our snow totals.
Last weekend's snow event, along with winter storm warnings for a few locations, was not too impressive. Yes, I saw analogs and earlier models point to a 2-5" snowfall for areas near and just north of the Ohio River. Actually, that proved more true than some of the short range models that overplayed forecasted amounts of at least 4-6".
Louisville's Muhammad Ali International airport came in at 2.3", Lexington at 1.7", and Bowling Green had 2.5". At my location in Valley Station, just southwest of Louisville's MAI, I had 2.4". I'll be updating totals this morning on my blog. Except for the northern part of Kentucky, most areas are still below normal in the snowfall department this season.
This week's chances for snowfall are mixed. My favorite teleconnections are mostly on board for more winter weather precipitation. The NAO continues to remain rather stubborn though, flirting with neutral and slightly positive values. That's predominately why we will see it warm enough here for plain liquid precipitation with leftover chances for back side snows and generally minor accumulations. But, we'll keep an eye on that midweek scenario.
But, there should be plenty of chances to add to that, as long as the cold air stays with us for a while.
Make it a good week. I may chime in with more posts related to snow and cold for later this week. Till then, have a good one and stay safe.
MS
Thursday, January 17, 2019
Mid-Month Update
January got off to a blistering start during its first several days of the month. Now, conditions have retreated some, but still Louisville and Lexington are averaging a little over 5 degrees above normal for the month of January, about what I was expecting by now.
It's going to take a lot of cold to offset the warm gains earlier this month. A promising look for the near term has Arctic air visiting us for almost a weekend stay, not what I would call a true vacation.
Recent trends now indicate some fluctuation in temperatures but with more cold air intrusion than warm air episodes. It may not be enough to offset these monthly gains, though. In addition, meteorological winter of December, January, and February may not finish below normal for temperatures as some have predicted. December's temperatures also averaged at least 5 degrees above normal. If January finishes some 2-3 degrees above normal, which is what I am projecting at this time, the month of February will have to come in at least 8 degrees below normal to offset the previous months' warmth.
It could happen. But, I'm still keeping the percentage in a 20-25 percent range for a below normal temperature winter.
One other thing. All locations except the far northern areas of Kentucky are running below normal in the snowfall department. Projections are for some improvement. However, for most in the state, they will continue a snow deficit for much of this month. February looks promising still. Most of our snowfall should fall during this month of February and perhaps part of March, which is technically outside of 'meteorological winter'.
MS
Tuesday, January 15, 2019
Ugly Analog For Upcoming Storm
February 15, 2003. Part of a massive storm system that produced blizzard conditions for some in the U.S. For some of us, though, here in Kentucky, it was an ice storm that brought Lexington to its knees.
https://www.kentucky.com/news/business/article44155008.html
http://weather.bloginky.com/2013/02/16/10-year-anniversary-of-the-2003-ice-storm/
Could something like that happen? Hopefully not this time. But, I am more convinced that ice will be in some of our official forecasts.
MS
https://www.kentucky.com/news/business/article44155008.html
http://weather.bloginky.com/2013/02/16/10-year-anniversary-of-the-2003-ice-storm/
Could something like that happen? Hopefully not this time. But, I am more convinced that ice will be in some of our official forecasts.
MS
Monday, January 14, 2019
MikJournal Monday 01/14/2019...All Teleconnections On Board
Ah. An interesting title for this week's MikJournal Monday. And thanks for visiting and welcome. Parts of our region were brushed with a taste of winter weather while the northern part of Kentucky was dumped on.
This last winter storm verified that the teleconnections were not all on board. I blamed it on the NAO for not being able to keep the cold air in place. I said last week that the northern part of the state stood the best chance for a significant winter event. Of course, at that time, the 'entertainment' models were all over the place and confidence in exact placement of winter precipitation was weak.
Now, I am pleased to announce that ALL teleconnections I follow are on board. What does this mean? A significant, region-wide winter event is looking more likely later this week into the weekend. I am talking about most, if not all of Kentucky could be looking at a significant winter storm or series of storms. Snowfall, freezing rain, sleet, rain, yes, these are all on the table. However, nearly all areas will experience what I would call a significant amount of winter precipitation.
My reasons for later this week and beyond are listed below....
The teleconnection patterns of the PNA, AO, and the NAO are favoring a winter scenario. One caveat that I do see but am not too concerned about yet is the AO and NAO may try and crush additional southern-fed systems to our south. This would still favor perhaps a part of our region experiencing additional winter weather. The highest likelihood would be far southwestern, southern, or southeastern KY.
But, for now, I am bullish on this winter stance coming at the end of the week. And it may very well stay with us for quite a while.
Take a look at the results of my latest Euro/GFS challenge. It was definitely surprising. Hopefully, I can do another one and have additional locations included from other areas.
Stay tuned this week to your favorite media sources for the next major winter weather player. Might be a good time to get your windshield wipers replaced, check on your automobile battery, and make sure you have a survival kit in your car in case you become stranded. Also, in the event of an ice storm, have extra batteries on hand in case of power outages, enough gas for portable generators, additional heating sources in case of power failures. Wrap and insulate any external water pipes. Disconnect any external water hoses from the house and turn off any water that is separate from the main. In other words, have a plan in place and stay safe.
Have a good week.
MS
This last winter storm verified that the teleconnections were not all on board. I blamed it on the NAO for not being able to keep the cold air in place. I said last week that the northern part of the state stood the best chance for a significant winter event. Of course, at that time, the 'entertainment' models were all over the place and confidence in exact placement of winter precipitation was weak.
Now, I am pleased to announce that ALL teleconnections I follow are on board. What does this mean? A significant, region-wide winter event is looking more likely later this week into the weekend. I am talking about most, if not all of Kentucky could be looking at a significant winter storm or series of storms. Snowfall, freezing rain, sleet, rain, yes, these are all on the table. However, nearly all areas will experience what I would call a significant amount of winter precipitation.
My reasons for later this week and beyond are listed below....
- Arctic air, yes, a very cold air mass will penetrate the region
- PNA+ trending negative, AO- trending positive, NAO- trending positive
- Cold air will be locked in at the surface
- Any impending storm system will have a harder time scouring out the cold air in place, at the surface and just above the surface
- Any snowpack will create even colder conditions, possibly low single digits to negative values, making it even more difficult for additional storm systems from the south to 'warm' us up very much
- Look for more 'overachieving' clipper-type systems to dive through the NW flow
The teleconnection patterns of the PNA, AO, and the NAO are favoring a winter scenario. One caveat that I do see but am not too concerned about yet is the AO and NAO may try and crush additional southern-fed systems to our south. This would still favor perhaps a part of our region experiencing additional winter weather. The highest likelihood would be far southwestern, southern, or southeastern KY.
But, for now, I am bullish on this winter stance coming at the end of the week. And it may very well stay with us for quite a while.
Take a look at the results of my latest Euro/GFS challenge. It was definitely surprising. Hopefully, I can do another one and have additional locations included from other areas.
Stay tuned this week to your favorite media sources for the next major winter weather player. Might be a good time to get your windshield wipers replaced, check on your automobile battery, and make sure you have a survival kit in your car in case you become stranded. Also, in the event of an ice storm, have extra batteries on hand in case of power outages, enough gas for portable generators, additional heating sources in case of power failures. Wrap and insulate any external water pipes. Disconnect any external water hoses from the house and turn off any water that is separate from the main. In other words, have a plan in place and stay safe.
Have a good week.
MS
Friday, January 11, 2019
GFS and Euro Challenge (Rules by MikJournal)
MONDAY A.M. UPDATE
And the winner of the challenge is...
I have gathered as much information as I can regarding snow totals. Most are exact, some are close estimates unfortunately. I cannot believe some of these 'official' reporting stations do not have a snow report. So, I did accept these 'few' estimates from the NWS pages. You will notice the storm totals next to the location. Despite the few estimates, I really do not think it would have made much of a difference. There was a clear winner for this challenge. In a mild upset, the winner is....
GFS
----------------------------------------------------------
That's right. Welcome to the MikJournal Snow Challenge between the superior Euro model and the doormat of forecast models, the GFS.
Who will win this challenge? The Euro, notorious for 'holding back energy from the Southwest'? Or the GFS, the model that seems to get lost in mid-thought?
Both claim medium-range forecasting as their niche. That's why these models should only be used at 4-7 days out from a storm system's ETA. I suggest neither of these models be used for short range forecasting. Leave that to the higher resolution and short-range forecast models like the NAM or HRRR.
Now, it's my rules. I get to choose the maps, the dates, the locations. After Sunday night, come Monday morning let's see how these 'snapshots' of this potential winter storm system unfolded by focusing on snowfall totals ONLY. I don't care about the rain, freezing rain, and sleet, just snowfall totals through Sunday night.
In this corner, here is a map of one of the Euro's runs on Tuesday, well into getting past that so-called Southwest Bias and still within an acceptable range for providing its 'superior' forecast.

And in this corner, The GFS' picture from the same day and applicable to the same time period from Friday through Sunday....

These are the maps I am using. No other maps.
Next, I choose the locations. As you can see, there are many locations represented by the amounts listed. For time purposes, I will select a FEW locations from Kentucky, Indiana, Illinois, and Missouri. These are the ONLY states I will use.
The locations listed below, I have no idea how they will do in terms of snowfall. But, I will gather the official snowfall readings from the NWS for Friday - Sunday night ending at Midnight(which would technically be Monday the next day). Remember, snowfall does not equal snow depth. You can actually have a dusting on the ground and still have 1" of snowfall recorded by the NWS.
I do not care how well one model did for other locations not listed. These are my rules. I choose the locations. I am grading this challenge solely on the amount of snowfall listed from the NWS through Sunday night, starting whenever on Friday, and only the locations I have chosen. I will not accept measurements from any other sources but the NWS offices for each location.
You will see each model's interpretation or estimate in inches. Then come sometime Monday or Tuesday, I will gather the official totals from the NWS offices and add up the differences. This challenge is not based on how many locations each model wins, but the grand sum of the differences. The model with the overall least difference wins this challenge. It's my rules.
Louisville: 2.9
Euro...6
GFS...2
Lexington: 2.1
Euro...7
GFS...6
Jackson: 0.4
Euro...5
GFS...4
Paducah: 0.6
Euro...7
GFS...3
Covington: 8.7
Euro...6
GFS...5
Terra Haute: 6
Euro...3
GFS...4
Evansville: 3.4
Euro...6
GFS...2
Indianapolis: 7.2
Euro...5
GFS...4
Muncie: 6
Euro...3
GFS...4
Bloomington IN: 3.6
Euro...4
GFS...4
Vincennes: 4
Euro...5
GFS...4
Effingham: 6.5
Euro...6
GFS...3
Carbondale: 4
Euro...8
GFS...3
Salem IL: 5.0
Euro...7
GFS...4
Cape Girardeau MO: 2.3
Euro...7
GFS...4
St Louis: 11.4
Euro...9
GFS...2
Springfield MO: 0.1
Euro...6
GFS...4
Rolla: 5.5"
Euro...9
GFS...7
I'll say right now, as I write this, St Louis is expecting nearly 12" snow, according to latest forecast. GFS might get slammed on that one alone.
I'll determine the winner with the data provided by the NWS offices for each of these locations on Monday or Tuesday.
MS
And the winner of the challenge is...
I have gathered as much information as I can regarding snow totals. Most are exact, some are close estimates unfortunately. I cannot believe some of these 'official' reporting stations do not have a snow report. So, I did accept these 'few' estimates from the NWS pages. You will notice the storm totals next to the location. Despite the few estimates, I really do not think it would have made much of a difference. There was a clear winner for this challenge. In a mild upset, the winner is....
GFS
----------------------------------------------------------
That's right. Welcome to the MikJournal Snow Challenge between the superior Euro model and the doormat of forecast models, the GFS.
Who will win this challenge? The Euro, notorious for 'holding back energy from the Southwest'? Or the GFS, the model that seems to get lost in mid-thought?
Both claim medium-range forecasting as their niche. That's why these models should only be used at 4-7 days out from a storm system's ETA. I suggest neither of these models be used for short range forecasting. Leave that to the higher resolution and short-range forecast models like the NAM or HRRR.
Now, it's my rules. I get to choose the maps, the dates, the locations. After Sunday night, come Monday morning let's see how these 'snapshots' of this potential winter storm system unfolded by focusing on snowfall totals ONLY. I don't care about the rain, freezing rain, and sleet, just snowfall totals through Sunday night.
In this corner, here is a map of one of the Euro's runs on Tuesday, well into getting past that so-called Southwest Bias and still within an acceptable range for providing its 'superior' forecast.
And in this corner, The GFS' picture from the same day and applicable to the same time period from Friday through Sunday....
These are the maps I am using. No other maps.
Next, I choose the locations. As you can see, there are many locations represented by the amounts listed. For time purposes, I will select a FEW locations from Kentucky, Indiana, Illinois, and Missouri. These are the ONLY states I will use.
The locations listed below, I have no idea how they will do in terms of snowfall. But, I will gather the official snowfall readings from the NWS for Friday - Sunday night ending at Midnight(which would technically be Monday the next day). Remember, snowfall does not equal snow depth. You can actually have a dusting on the ground and still have 1" of snowfall recorded by the NWS.
I do not care how well one model did for other locations not listed. These are my rules. I choose the locations. I am grading this challenge solely on the amount of snowfall listed from the NWS through Sunday night, starting whenever on Friday, and only the locations I have chosen. I will not accept measurements from any other sources but the NWS offices for each location.
You will see each model's interpretation or estimate in inches. Then come sometime Monday or Tuesday, I will gather the official totals from the NWS offices and add up the differences. This challenge is not based on how many locations each model wins, but the grand sum of the differences. The model with the overall least difference wins this challenge. It's my rules.
Louisville: 2.9
Euro...6
GFS...2
Lexington: 2.1
Euro...7
GFS...6
Jackson: 0.4
Euro...5
GFS...4
Paducah: 0.6
Euro...7
GFS...3
Covington: 8.7
Euro...6
GFS...5
Terra Haute: 6
Euro...3
GFS...4
Evansville: 3.4
Euro...6
GFS...2
Indianapolis: 7.2
Euro...5
GFS...4
Muncie: 6
Euro...3
GFS...4
Bloomington IN: 3.6
Euro...4
GFS...4
Vincennes: 4
Euro...5
GFS...4
Effingham: 6.5
Euro...6
GFS...3
Carbondale: 4
Euro...8
GFS...3
Salem IL: 5.0
Euro...7
GFS...4
Cape Girardeau MO: 2.3
Euro...7
GFS...4
St Louis: 11.4
Euro...9
GFS...2
Springfield MO: 0.1
Euro...6
GFS...4
Rolla: 5.5"
Euro...9
GFS...7
I'll say right now, as I write this, St Louis is expecting nearly 12" snow, according to latest forecast. GFS might get slammed on that one alone.
I'll determine the winner with the data provided by the NWS offices for each of these locations on Monday or Tuesday.
MS
Wednesday, January 9, 2019
NAM That Tune
24-Hour Update Most recent run of the NAM (12z 01/10)
Trend continues northward jog of heaviest precipitation through Sunday evening. If all snow, could be a smackdown. This is for areas along and just north of the Ohio River nearest central and northern Kentucky. Still hard to gauge how the western part of the state will be impacted. But areas further north there too, if all snow, could be significantly impacted. With this northward expansion of more liquid, could there be more of a mix than even what the NAM is showing? That's why I say let's see what the evening run shows. Some of these snow totals look a little too aggressive.
-----------------------------------------------
First full reliable run (12z 01/09)of the NAM is in....well, it looks like a mess.
Using the data from this run, this is what I can interpret.
Initial band of snow overspreads the region Friday night. Possible 1-3" amounts for quite a few. There could be isolated 4" amounts and the snow could be very dense. A break in the action during the day Saturday as rain or rain/snow mix moves back in during the afternoon thereby melting much of the overnight accumulation. This goes through Saturday evening.
This continues the theme of an increasingly wet solution. At the same time, those who get mostly snow will see a modest amount.
I like the NAM at or just within 24 hours of storm arrival for a most accurate interpretation. So, give it a few more runs through at least tomorrow evening.
I will update this page as additional runs come in, likely the 12z run tomorrow and the 0z run Thursday evening.
MS
Monday, January 7, 2019
MikJournal Monday 01/07/2019...Fun Stats
Welcome to the first MikJournal Monday of the new year. Hopefully, for some, this will be a better year for weather. Unfortunately for some, that's why we have historical and recordable observations. After all, that is how many of us found out last year was our wettest year on record.
This time, though, I would like to uncover some statistics and put a different spin on them. Will this have any correlation with how our weather will play out the rest of this winter? Probably not. It's still fun to look at them.
For example, the month of November 2018. I know I remember it. We had an ice storm that knocked me off the power grid for nearly 40 consecutive hours. The living room was a chilly 52 degrees.
During November, Lexington recorded 3 days of measurable snowfall or sleet. While that in itself does not sound amazing, leafing through the pages of history, the maximum number of days of measurable snowfall in November has been 5 days. This occurred during the snow season of 1972/73 and 1950/51.
It was quite interesting to uncover what happened the rest of the winter. The snow season of 1972/73 saw measurable snowfall for 7 consecutive months of the year. Yes, October through April. The winter months of December through February produced above normal temperatures for December and January, but below normal temperatures for February. The month of March was well above normal and April came in at below normal. The snow season total came to a whopping 5.3". Let me retype that again...5.3". Yep, 5.3".
Rewind to the snow season of 1950/51. Those 5 days in November were a bit more snow-efficient. In fact, to this day, November 1950 is the snowiest month in Lexington's climatological history at 9.7". How did the rest of the winter fare? How does 41.7" sound? Yes, that is still the 5th snowiest snow season on record for Lexington.
But, back to those 3 days in November 2018. The accumulated snowfall was not much, 1.0". Add December's 1 and only day of measurable snowfall of 0.1" and you have a fairly slow start to the snow season.
During the 1911/12 snow season, the accumulated snowfall for those 3 days in November was not much, 1.8". December only had 1 day of measurable snowfall, 0.3" producing 2.1" for the two months combined. Again, not a very impressive start. But, they wound up with 23.9". Not bad. For the winter months of December through February, the total was 16.5", again a modest number.
Temperatures during the 1911/12 snow season averaged 4.8 degrees above normal in December, 9.8 degrees below normal in January (5th coldest January on record), and 9.3 degrees below normal in February. March was a little better at 6.2 degrees below normal along with over 5.5" snowfall for the month.
Now, looking at the present, Lexington did enjoy some relative warmth in December at 5.0 degrees above normal. However, I am going to go out on a limb here and say that Lexington will not have a 9+ degrees below normal month for this January. Right now, they are sitting pretty at 10.5 degrees above normal through the first 6 days with expected temperatures over the next couple of days of 15-20 degrees above normal today and at least 10 degrees above normal tomorrow before a more realistic winter pattern sets in for a few days this week.
That brings us to the upcoming weekend. Indications are showing a possible winter scenario unfolding for our region. So, how about it? Well, while your professional forecasters, who can give you a winter snowfall total for 3 months in advance, but cannot do so at now less than 6 days out, discuss the potential for frozen precipitation by using waffling models, I go a little beyond that and discuss other contributing factors besides these unreliable models this far out.
Using the teleconnections, the AO does show a definitive V-shape signature indicative of a potential winter storm for at least parts of our region. As I have explained before, the AO has to be in the negative phase, bottoming out, then trending positive toward the neutral line. Somewhere along that positively trending line will be our winter storm potential. And it does align with the possibility for precipitation breaking out according to the models.
However, the AO is not the only game in town. Other teleconnections have to contribute. Recently, I have reviewed the PNA pattern and like what I see. A positive PNA trending a little negative toward the neutral line. That's another strong indication for winter storm potential.
Unfortunately, I do not have access to the EPO data thanks to our wonderful government shutdown .
Regardless, what I am most disturbed about this upcoming week's winter storm potential is the behavior of the NAO. It would be nice to have a nice blocking signal in the northeast to help keep the cold air from getting away too fast. But, the GFS ensembles have consistently shown agreement that there is no definitive signal for a significant blocking pattern to develop by this weekend.
What does this mean for our region? We will have a cold, Canadian air mass over the next few days. This is not an Arctic air mass. It will not have shallow, cold air trapped at the surface. Once this storm system moves in, warmer air will become drawn into the region. How much warmer air really depends on any blocking to our northeast. If it's not a significant block, the cold air is just going to be pushed aside.
Could we still see frozen precipitation? Yes, parts of our region could see frozen precipitation. However, temperatures at and above the surface will be marginal in supporting all snow. This kind of setup could lead to a heavy wet snow for some, a rain/sleet/snow mix for some, and a mostly liquid event for some.
Right now, and of course this is going to change since some of the short term models will be sampling this thing soon, I would expect far northern Kentucky to see the highest chances (and it's really not that high to begin with) for snowfall this weekend. The rest of us will have to put up with a mixed bag of snow/sleet/rain.
Again, it's something to watch. It will be fun watching these forecast models giveth and taketh away. People really rely on every single run of these models for some reason. It's like grab a beer and let's see what the next run give us. If it's not good, just bring the whole keg and let's forget about the whole thing. Whatever.
Have a good week. I'm sure you'll be tuned in to your favorite media sources for the latest updates on our next storm system.
MS
Friday, January 4, 2019
MikJournal January Outlook...Finally
Well, let me start by being open and frank. This government shutdown business is not good for weather business. The normal tools this armchair meteorologist utilizes cannot be accessed. That requires additional research which leads me to another dead end. Why? Uh, government shutdown, again.
And guess what? 'They' are still going to be paid. 'They' know who I am talking about.
So, we will make the best lemonade possible from these 'lemons'. Thankfully, not much of an outlook is needed.
I'll tell you why in just a moment. First, the month of December here in Kentucky was above normal in terms of temperatures and precipitation. Temperatures ranged from about 2.5 degrees to as much as nearly 5.5 degrees above normal. For you professional meteorologists who like to give your 'winter forecasts', some of you are off to a sluggish start. If your winter forecast, that's right, December through February, was for below normal temperatures, any below normal months we might experience will now have to be offset by the first month of December's relatively mild readings.
Next, throw in the month of January. If you were hoping this month was going to be the coldest month of the winter, well, the reference sources I have been able to use, which are not many unfortunately, have consistently presented an above normal temperature regime for the first half of the month, perhaps some 6-10 degrees above normal. Winter will have to really kick it up a notch to offset this difference in addition to December's gains.
I will say that this run of above normal temperatures cannot be sustained. Chunks of cold air will continue to drop toward our region later this month, even if it is just a little bit below normal. At the same time, I am not as confident about long-lasting cold like what we experienced last winter during late December into January. This applies only to the month of January. At the very worst, this January will likely be above normal, even if it is just a few degrees.
I do expect February to be colder than normal. I'm still sticking to that one. But, I was also expecting more of a fight from Old Man Winter during his prime time month for snow and cold here in January. It will be interesting to see if my February Outlook will have to be altered if this persistent 'warmth' continues. But, that's for another time, and hopefully, those 'kids' responsible for looking after the cleanliness of our parks and those other 'kids' who do not know how to throw away their garbage by putting them in proper receptacles, will be a thing of the past. Trust me, I am not going to hold my breath on that one.
MS
Tuesday, January 1, 2019
Regional Wettest Years Ever List 2018
What a fitting way to end the year 2018...rain. And why not. Several locations in and around Kentucky set all-time precipitation records for the year. Here is a brief list of these locations....
Jackson TN.................77.10"
Crossville TN.............74.88"
Lexington KY............71.98"
Frankfort KY..............68.94"
Louisville KY.............68.83"
Jackson KY................67.98"
Danville VA...............67.61"
Charleston WV...........67.05"
Lynchburg VA...........65.70"
Elizabeth City NC......63.95"
Roanoke VA...............62.45"
Alderson WV..............61.51"
Columbus OH............55.18"
MS
Subscribe to:
Posts (Atom)
-
Recently, I noticed that our days have now begun to shorten. However, our sunset here in Louisville still remains at 9:10pm edt. Starting th...
-
 In July of this year, I did a segment about the latest sunsets in the eastern time zone. This corresponded nicely with the summer solstice a...
 -
A 1 Temperature C Humidity F Heat Index 2 81 82 86.82 This is an Excel spreadsheet program. Fairly ...
