Friday, September 30, 2011

If There's Gonna Be Snow...

Wow, can you believe it? That 4 letter 'S' word in the month of October, early October at that. I  will be introducing a new graphic on my blog, along with other traditional methods of reporting snowfall.

Track snow accumulations as they come in...


Although accumulations would only occur in the highest elevations of the Appalachians, it's still fun to hear that snow is already being mentioned in some forecast circles.

MS

Thursday, September 29, 2011

Looking Ahead to October....

The month of October is traditionally a pivotal month meteorologically. Our first frost normally occurs during this time, ultimately leading to a possible end to the growing season by the end of the month when a killing frost can occur.

Also, as I have stated in my Working On the Winter Weather Forecast segments, October is a month to start looking for changing weather patterns that may provide a precursor of what to expect for our upcoming winter.

As you may have been aware, much of Kentucky was experiencing abnormally dry conditions and even moderate drought conditions in some locations.

DateNoneD0-D4D1-D4D2-D4D3-D4D4
09/27/1186.7213.280.040.000.000.00
09/20/1150.3049.7010.650.000.000.00
09/13/1150.3049.7016.140.000.000.00
09/06/1152.2147.7916.550.000.000.00
08/30/1128.8371.1731.024.270.000.00
08/23/1139.8960.1111.600.000.000.00
08/16/1145.0854.925.770.000.000.00
08/09/1183.1816.820.000.000.000.00
08/02/1183.1816.820.000.000.000.00
07/26/1192.867.140.000.000.000.00


The most significant change in this chart is the change in drought status from September 20 to September 27. Notice that nearly half of the state was experiencing at least abnormally dry conditions during the September 20 report. As of the September 27 report, over 86% of the state had been classified as drought-free.

Here is a map of those of us still having abnormally dry conditions...

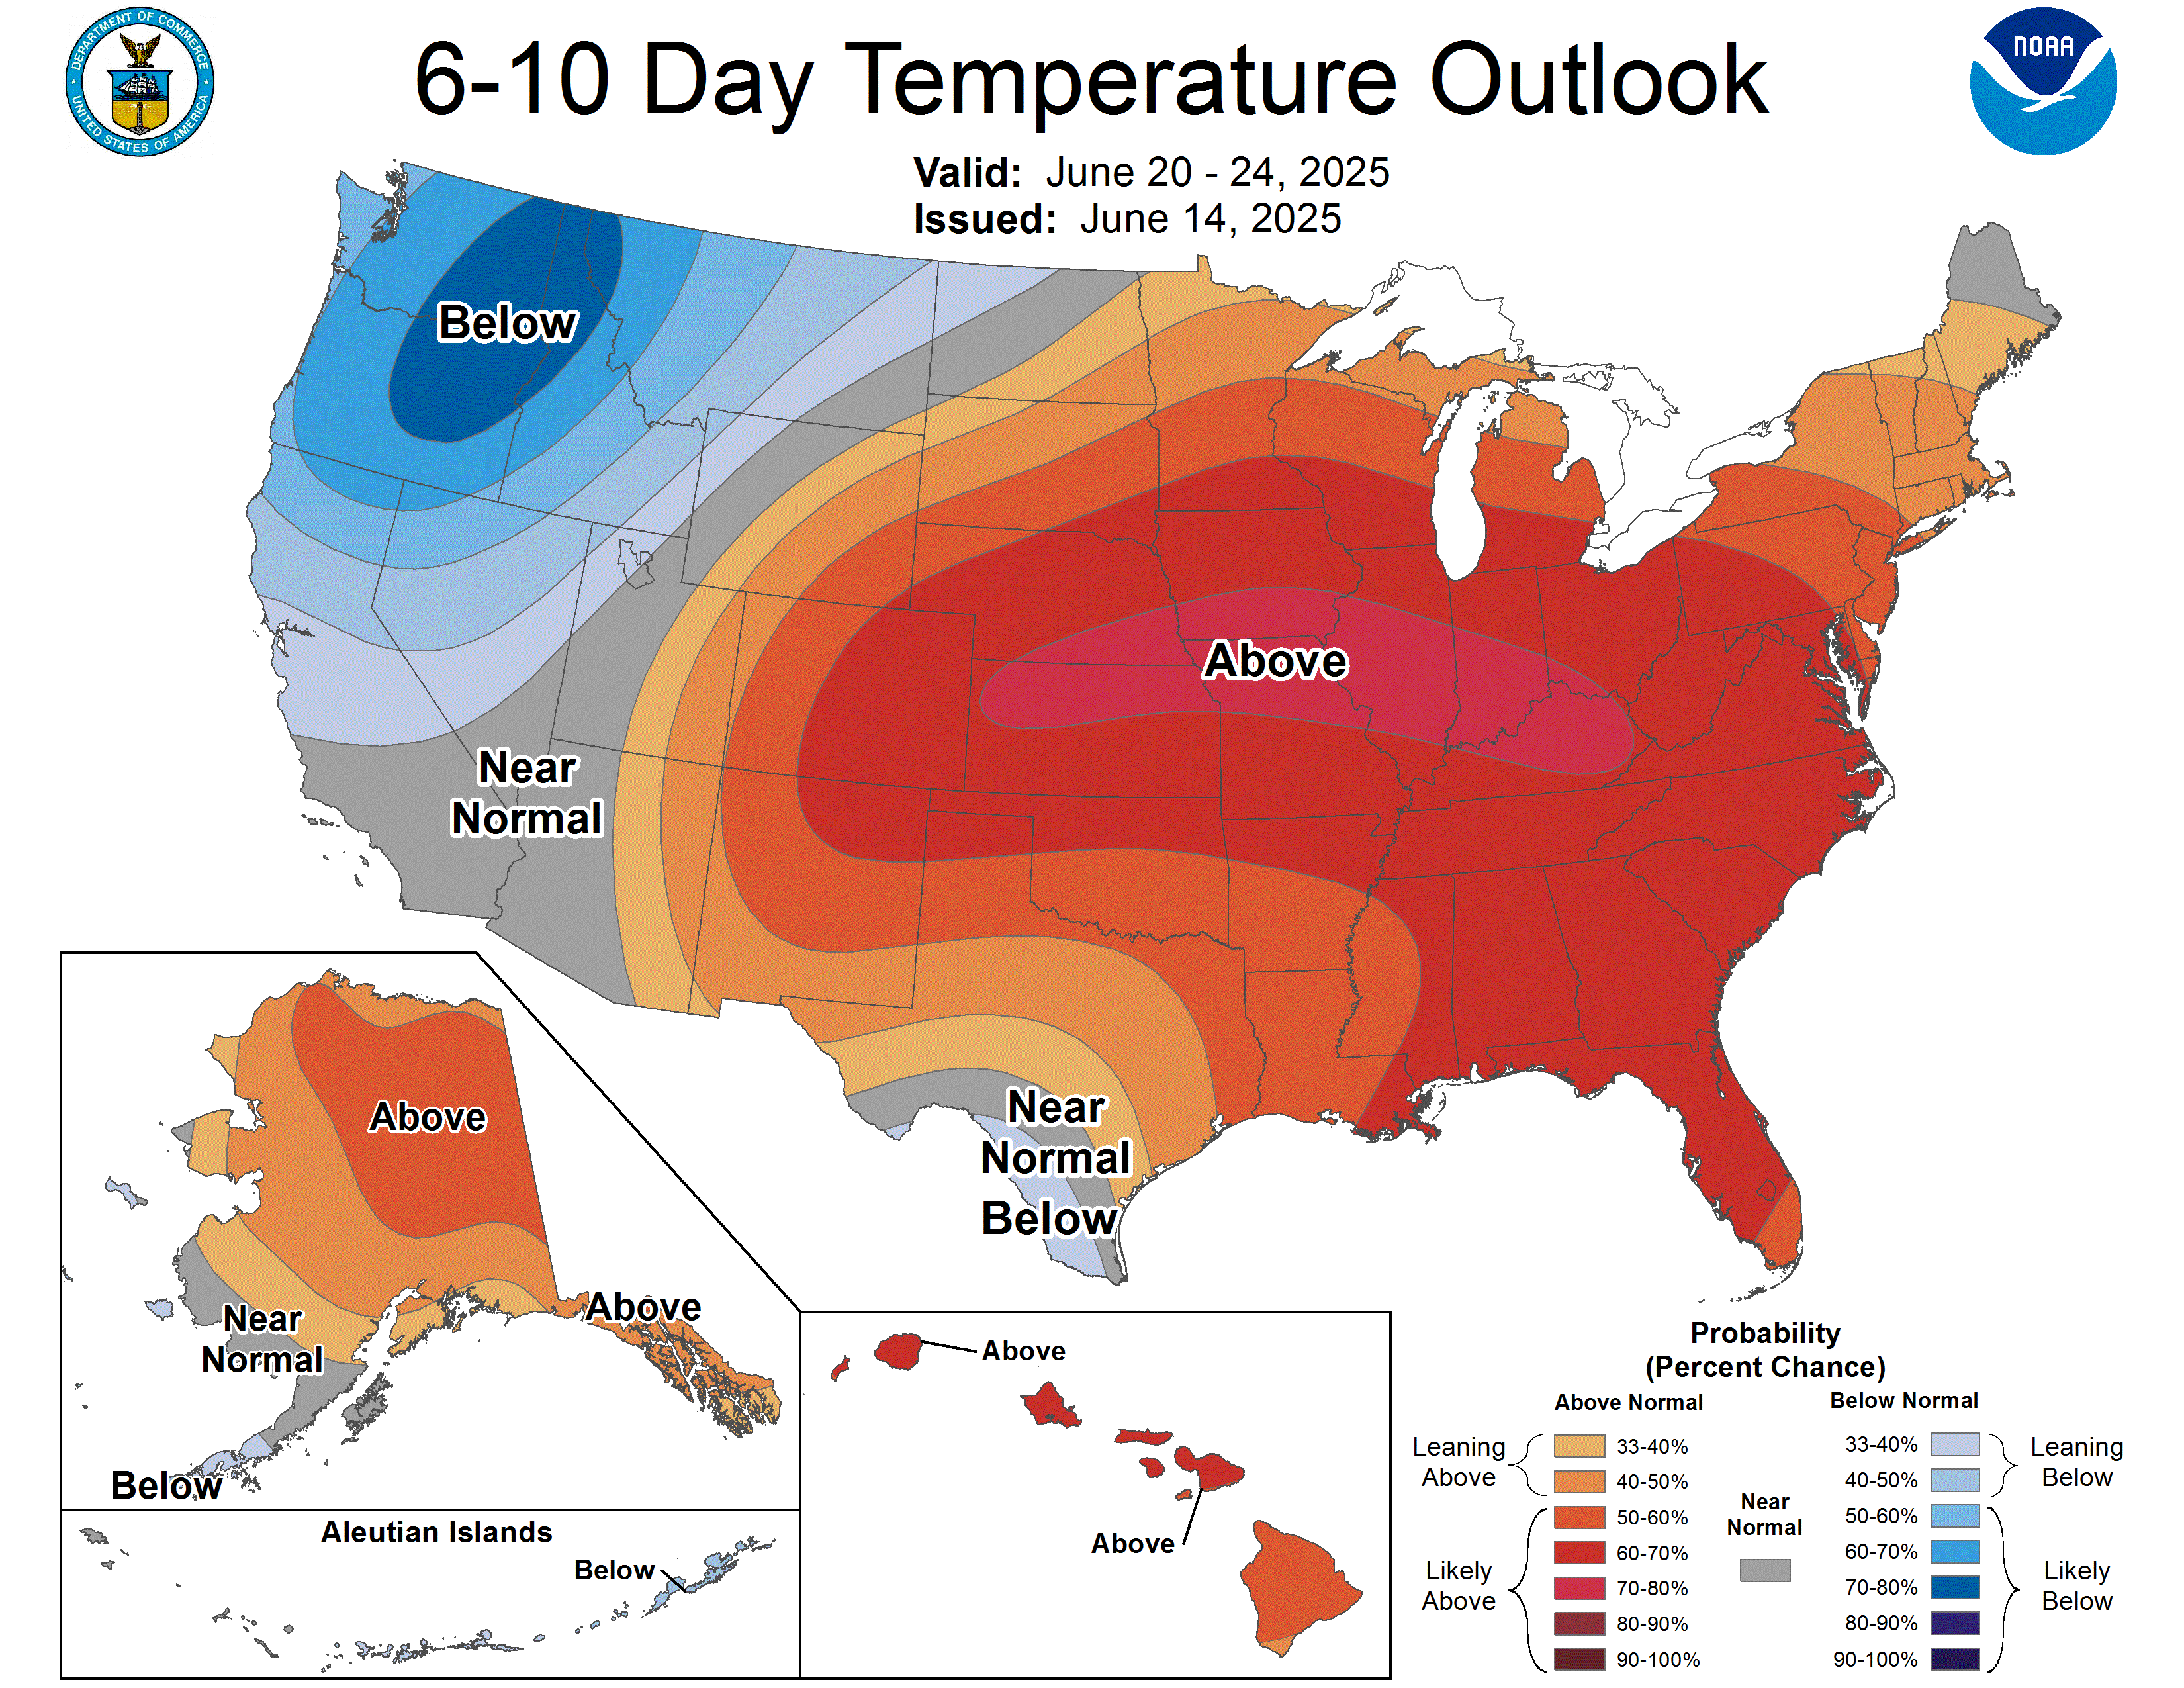
The CPC has this to say about the 6-10 day temperature outlook. This will follow our below normal readings coming up soon...

This is for Oct 5-9: above normal for us.


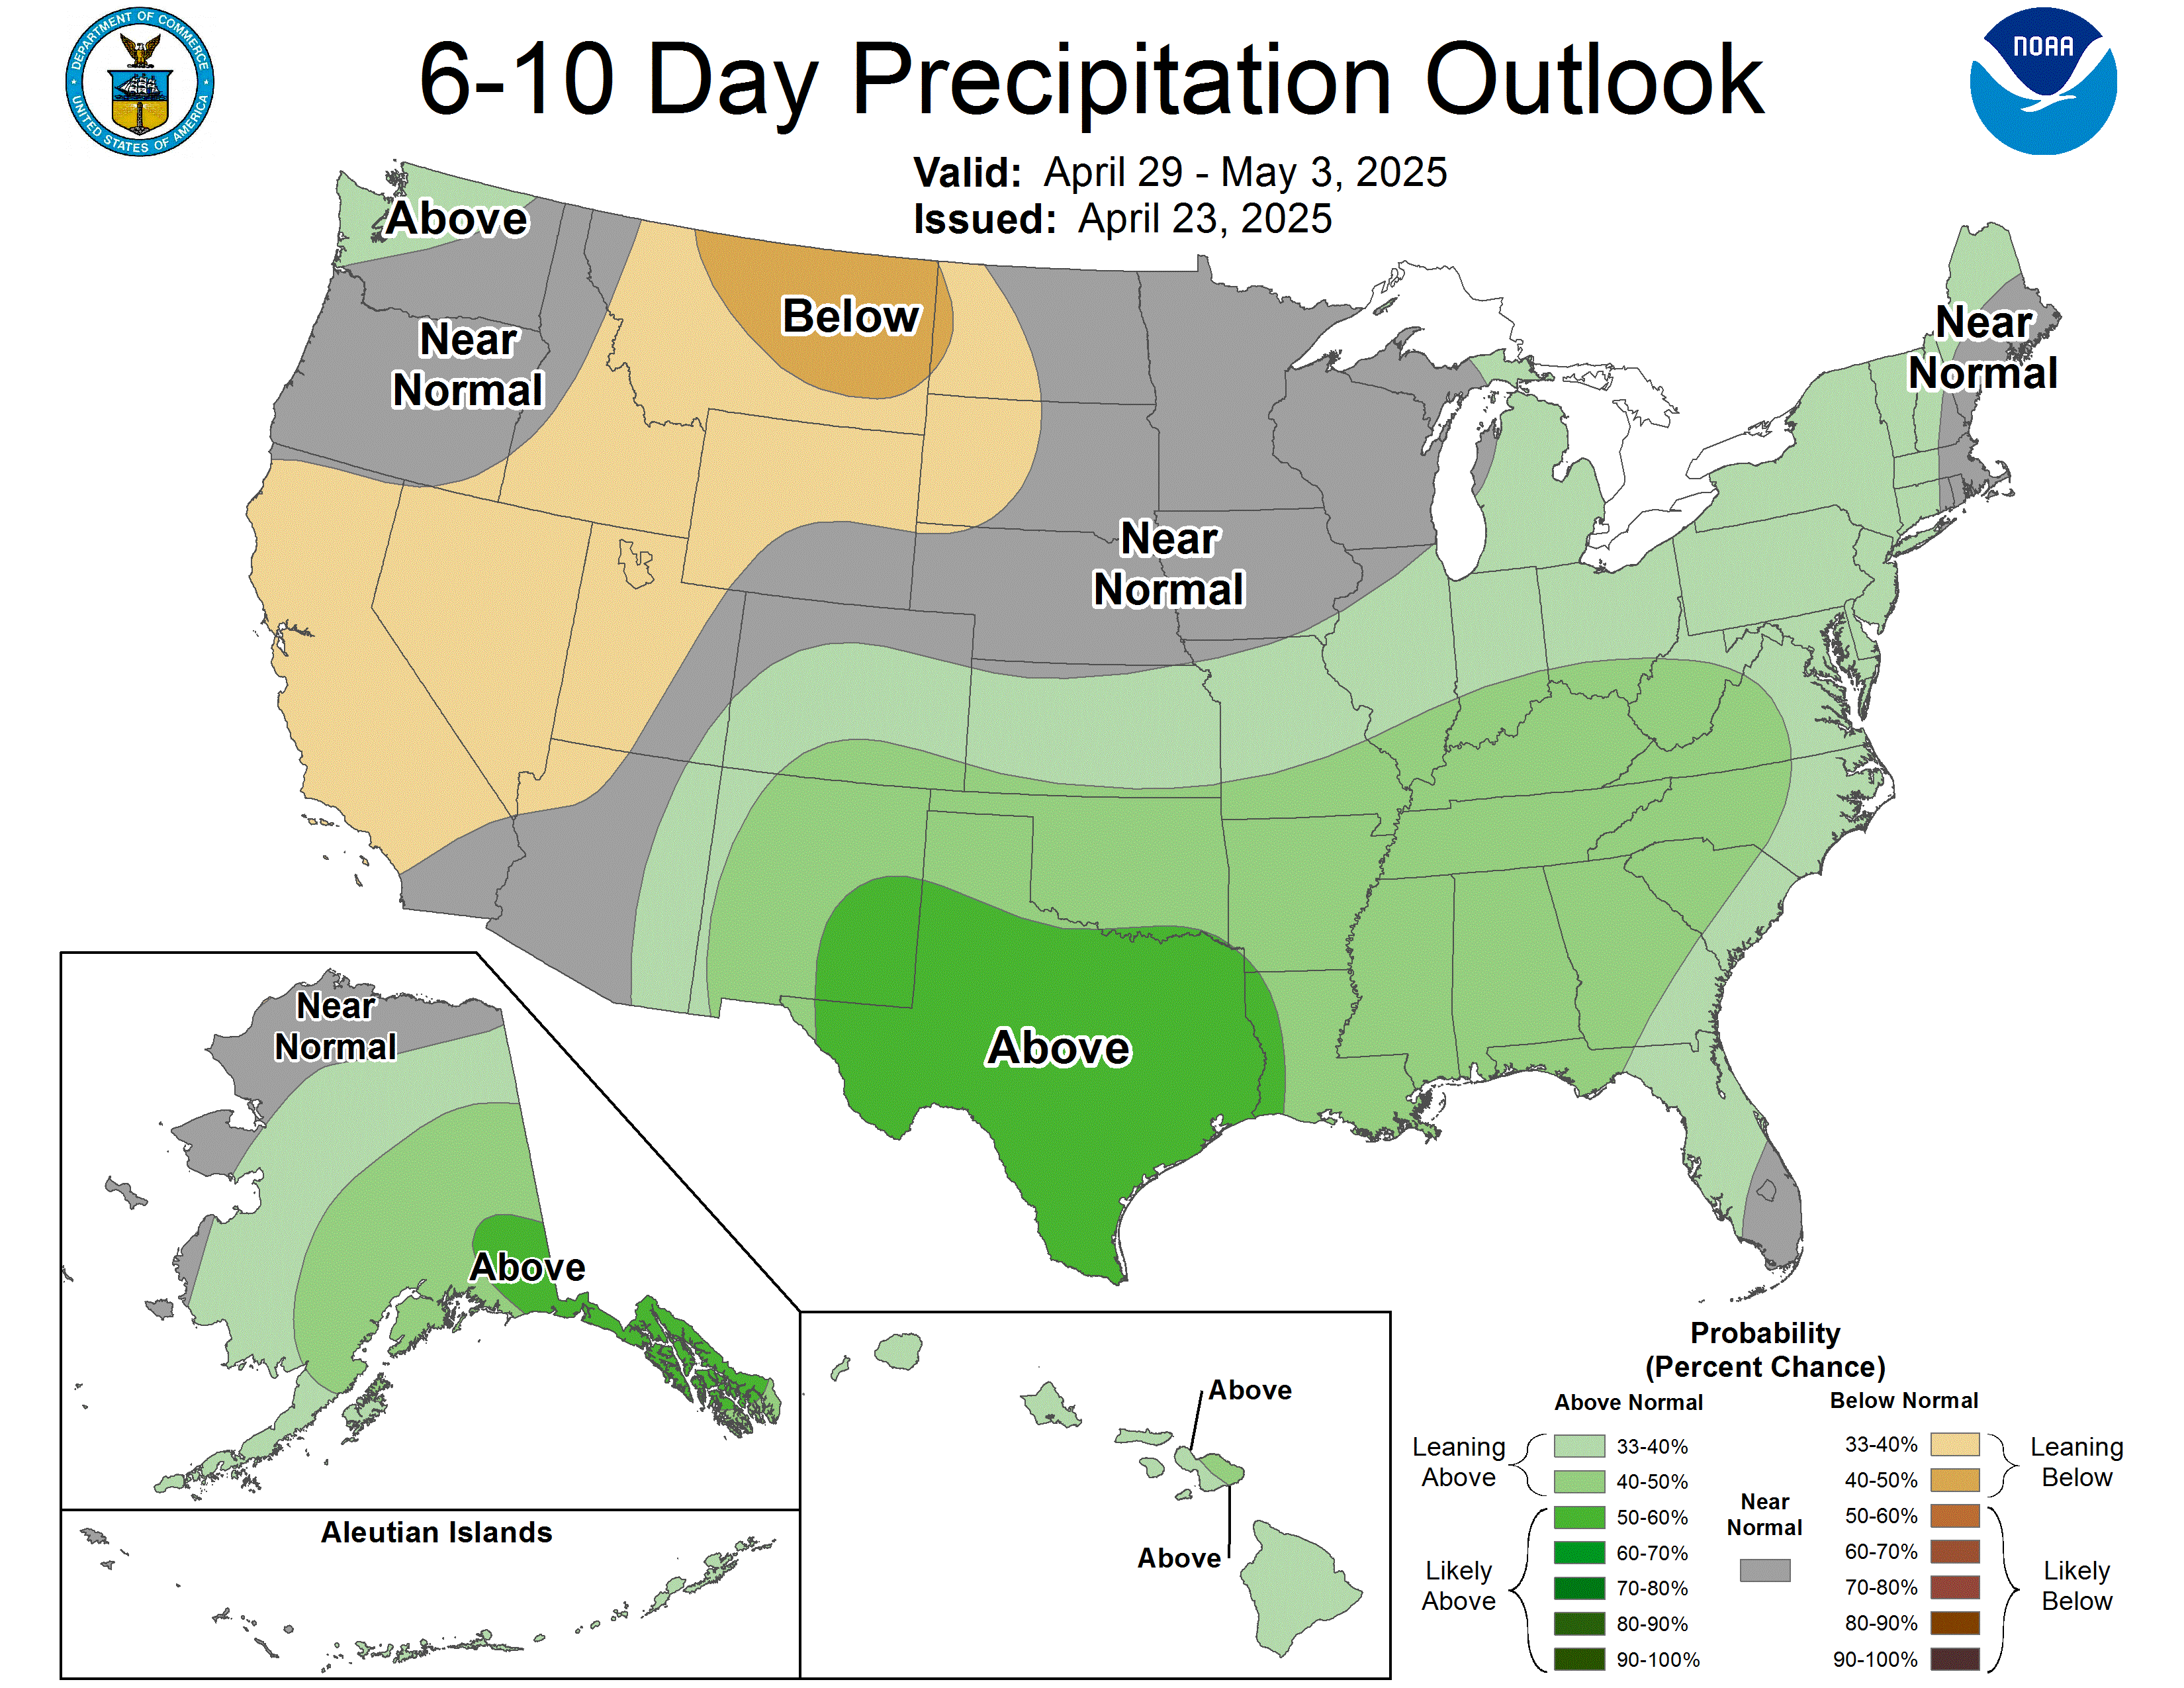
And this for its 6-10 day precipitation outlook, for the same October 5-9 period: below normal for us.


This should get us through the first 10 days of the month. Not too bad, really.

For the near term, I'm still questioning whether the bulk of the cold air will be as bad here in Louisville as it will be just to our east. I do see high temps struggling to get out of the 50's either Saturday or Sunday. Yet, cloud cover may keep our overnight lows from bottoming out too much, perhaps in the 42-46 range.

However, to our east, if skies clear enough, frost will become an issue for them, with temps reaching the mid to upper 30's. Best chance of this is across far eastern Kentucky. Even with cloud cover, temps may still dip into the upper 30's in these areas.

More updates coming later or as they become available.

MS

Tuesday, September 27, 2011

Canadian Areas Warmer Than We Are

It really is something to see what a difference some cutoff low can do for you. Our temperatures have been well below normal here. Temps did reach the low to mid 70's in places. However, in west central Canada, they're experiencing temperatures just as warm, thanks to a building ridge.

That ridge will move east and give us a nice, warmer afternoon for Thursday, possibly upper 70's to near 80.

Then, the next shot of cool air will dive into the region with the coolest readings of the young Fall season.


Click on the map above and follow the warmth...for now.

MS

Working On the Winter Weather Forecast PART 2 - October/November 2000 Data

In part 1, I discussed the data from the Jan/Feb 2000 Winter, primarily because we were in the grips of an impressive La Nina then. You can review the data from accessing the archived posts of September 17 2011.

However, you may be asking, what role would this play in our upcoming winter of 2011/2012?

I introduced the early 2000 data to show what impact a strong La Nina produced. Seemingly, the data correlated somewhat better than I imagined with a typically strong La Nina. Later, though, that La Nina began to fade, but did return later in the year. This second La Nina would not be as strong as the previous one. Therefore, one would expect that the data correlation would not be as favorable.

In my previous post discussion about the Winter Weather Forecast for 2011/2012, I mentioned how I would research the October 2000 data in order to determine any specific weather pattern that could help figure out how the winter of 2001 and La Nina's impacts would unfold. Then, hopefully, this would shed some light on how winter of 2011/2012 will  be.

Well, here's what I found.

First, the latter part of Summer 2000 saw above normal temperatures for our region. Sound familiar(FF to 2011)? Then, the month of September featured below normal readings. Looks like we'll finish September on a below normal basis as well. October saw temperatures above normal for much of the central U.S., including Kentucky. So far, the Climate Prediction Center is forecasting above normal readings for much of the central U.S for our October 2011. 

However, I really could not find a specific weather pattern change that could help us figure out how the upcoming winter of 2001 would fare...at least in October. There were some subtle introductions of colder air pouring into the northern parts of the Intermountain West region by the end of the month, but not the definitive, season-altering pattern shift (what I like to call SAPS) that I wanted to see.

Therefore, I needed data from the month of November. Finally, by the 6th of the month, a significant display of cold air began intruding the far northern areas of the United States via the Arctic regions. Our part of the country actually held onto the warmer air for a while. But, by the 9th of the month, it was obvious, our warm readings wouldn't make a return.

We weren't the only ones experiencing the cold stuff...Check out this graphic for November's temperatures:


November 2000 proved to be the 2nd coolest month on record for the United States.

As far as precipitation, first, I wanted to show this map of the 'snow cover anomaly map'. This shows where much of the country experienced snowfall amounts not normally seen like this during the month of November:


Overall, precipitation would prove to be greatest in the midsection of the country for the month.

Again, I just want to remind readers that I'm NOT suggesting this is how weather events will work out for our winter of 2011/2012. La Nina II was really just getting going by then. Also, all weather is interrelated. I try and look at how the rest of the globe was faring, again, hoping to find trends as to how our winter MIGHT go.

Here's a look at what I'm talking about...


With this snow cover anomaly map for Europe and Asia, can you tell where areas were perhaps warmer and colder than normal?

Let's see how you did. Here's the surface temperature map. Some data may be missing, but you get the picture...


For those of you who are interested in numbers for other variables that could contribute to winter weather, here is a look at those numbers...for November 2000.

NAO  (-0.92)
PNA   0.74
AMO (-0.015)
PDO (-0.53)
ENSO Oct/Nov/Dec (-0.6) La Nina conditions
AO (-1.581)

In my next segment, I will be looking at how the rest of the winter 2000/2001 progressed based on the SAPS test, La Nina conditions, and the other variables.

You can also look at some of the data I've been looking at by visiting the HPC website's 'Daily Weather Map' section HERE.

MS


Add Another One to the Record Books

September 2011 has now become the 9th wettest one on record at 5.72". With another shot at rain about midweek, we could easily move up into the 7th position.

Supporting an unusually wet year, we have also had the wettest April on record and the 9th wettest June.

Remember, we have already breached our average precipitation for the year; 44.91" is the latest average annual statistic I have on file. We actually surpassed that on August 7.

At 52.79" for the year, we only need 3.53" to break into the top ten wettest years on record.

MS

Monday, September 26, 2011

Wow...Talk About Drought-Busting!

Did someone say we were under some type of drought??? Uh...all I know is that I was under some type of cloudburst that even the Energizer bunny would have a hard time keeping up with.

Check out some of these rainfall totals during the past 24 hours...(these are unofficial)

At my location in Valley Station - nearly 3.50"
Louisville Int'l - 3.36"

Here are some from the volunteer network CoCoRaHS...
Enlarge the map above and see some locations nearby your place. Overall, our region had some of the heaviest 24-hour rainfall totals, again, unofficially.

Other rainfall totals from MSD rain gauges...
ID
Site
Rainfall
Daily
Rate
Total
(in./hr)
(inches)
TR01
D. R. Guthrie WQTC
0
3.43
TR02
PRP Fire Station Training Facility
0
3.92
TR03
Shively PS
0
3.77
TR04
Morris Forman WQTC
0
3.9
TR05
Beargrass Creek PS
0
3.77
TR06
Hite Creek WQTC
0
1.91
TR07
Floyds fork WQTC
0
1.17
TR08
Fern Creek Fire Station #3
0
1.15
TR09
Cedar Creek WQTC
0
1.24
TR10
Camp Horine (Jefferson Co. Forest)
0
2.37
TR11
Northern Ditch PS
0
2.72
TR12
Nightingale PS
0
2.98
TR13
St. Matthews Elementary School
0
2.36
TR14
Lea Ann Way PS
0
2.11
TR15
Jeffersontown WQTC
0
1.03
TR17
Mt. St. Francis
0
0.5
TR18
IVY Tech
0
1.67
TR19
Fairdale High School
0
2.66
These totals above represent amounts since midnight.

MS 

Noisy Storms in Louisville

1:45am LAST update
Winding Bluff Trace - residential fire alarm, water leaking from ceiling near the Brownsboro rd area and Watterson X-way

Over 4,000 outages in Jefferson county

More heavy rain moving back into the area...
From NWS Louisville - Flood advisory
AT 132 AM EDT...LOCAL LAW ENFORCEMENT OFFICIALS REPORTED SEVERAL
ROADS FLOODED...INCLUDING FLOYD ROAD AT SEVERAL INTERSECTIONS.

DOPPLER RADAR HAS INDICATED THAT AREAS OF JEFFERSON COUNTY WEST OF
INTERSTATE 65 HAVE RECEIVED THE HEAVIEST RAINS. LOCAL GAGES HAVE
INDICATED THAT UP TO TWO INCHES OF RAIN HAD FALLEN OVER THE PAST 2
HOURS NEAR DIXIE HIGHWAY AND SHIVELY.

ANOTHER LINE OF STORMS WITH HEAVY RAIN WILL APPROACH THE WESTERN
LOUISVILLE METROPOLITAN AREA BY 2 AM EDT. ANOTHER INCH IS LIKELY
ACROSS MUCH OF JEFFERSON COUNTY.

1:35am update
tree on house at Sheperdsville rd


1:25am update
Over 3,900 in Jefferson county without power, mostly in the 40219 zip code or the Okolona area.

1:20am update
Rain totals here in Valley Station over 1.5" now, most of that occurring with this line of storms pushing through during the last hour.

Severe T'Storm warning for Jefferson county

1:10am update
Fire officials say nothing showing at Morton ave.
Farnsley Rd - electrical box fire
Winds are picking up here at my location...

1:00am update
So far, no reported house/business fires as of 1:00am...As I'm typing this, an electrical structural fire being reported near Barrett ave and Edwards St at Morton ave. Sounds like an electrical box.

Now, a residential fire in Valley Station at 11000 block Pierce Way in Leemont Acres

12:55am update
Many security alarms being tripped. Fire officials having to respond...

12:50am update...
2814 S Third St - Transformer fire, sparks along wires down toward the stadium
------------------
Ok, I'm awake. I was asleep, but no more. That was some intense lightning a few minutes ago. At 12:40 am, about 100 customers in Valley Station with no power, mainly due to lightning. My lights flickered, messed up the alarms, etc....Now, the heavy rain is moving in.

Pleasure Ridge Park is also reporting outages, a little less than 100 now. As far as Jefferson county goes, the number is over 300. That number should rise as long as the lightning remains this intense.

Checking for housefires on scanners this morning. Updates may be forthcoming.

MS

Tornadoes on Easter Sunday

This is a worse case scenario. Tornadoes and flooded, blocked roadways making for great difficulties reaching residences affecting hard hit ...